Overview
In a previous post, we described how to simplify industrial data management by deploying a complete Industrial Edge node using Docker containers and our customized MING stack (MQTT, InfluxDB, N3uron and Grafana). As we explained, this architecture enables consistent, versioned, portable and scalable deployments that increase operational efficiency.
Let’s take a closer look at the components of this stack:
- MQTT: A lightweight and efficient, publish-subscribe protocol.
- InfluxDB: A time-series database that is optimized for storing, querying and visualizing time-stamped data.
- N3uron: A lightweight industrial platform for DataOps that runs on devices at the edge of the network.
- Grafana: A popular open-source platform for visualizing and analyzing time-series data.
When it comes to scaling projects, remotely managing all connected devices can become a daunting task for an IT team. Deploying software updates and critical fixes, as well as performing scheduled maintenance across multiple Edge Nodes and vast geographical distances can be challenging. That’s where balena comes in, balena is a complete IoT fleet management platform that allows deploying, managing, and scaling fleets of IoT Linux devices.
In this article, we present a variant of the above-mentioned architecture that uses balena. Additionally, for this example, we will substitute HiveMQ for Mosquitto to make the solution even lighter.
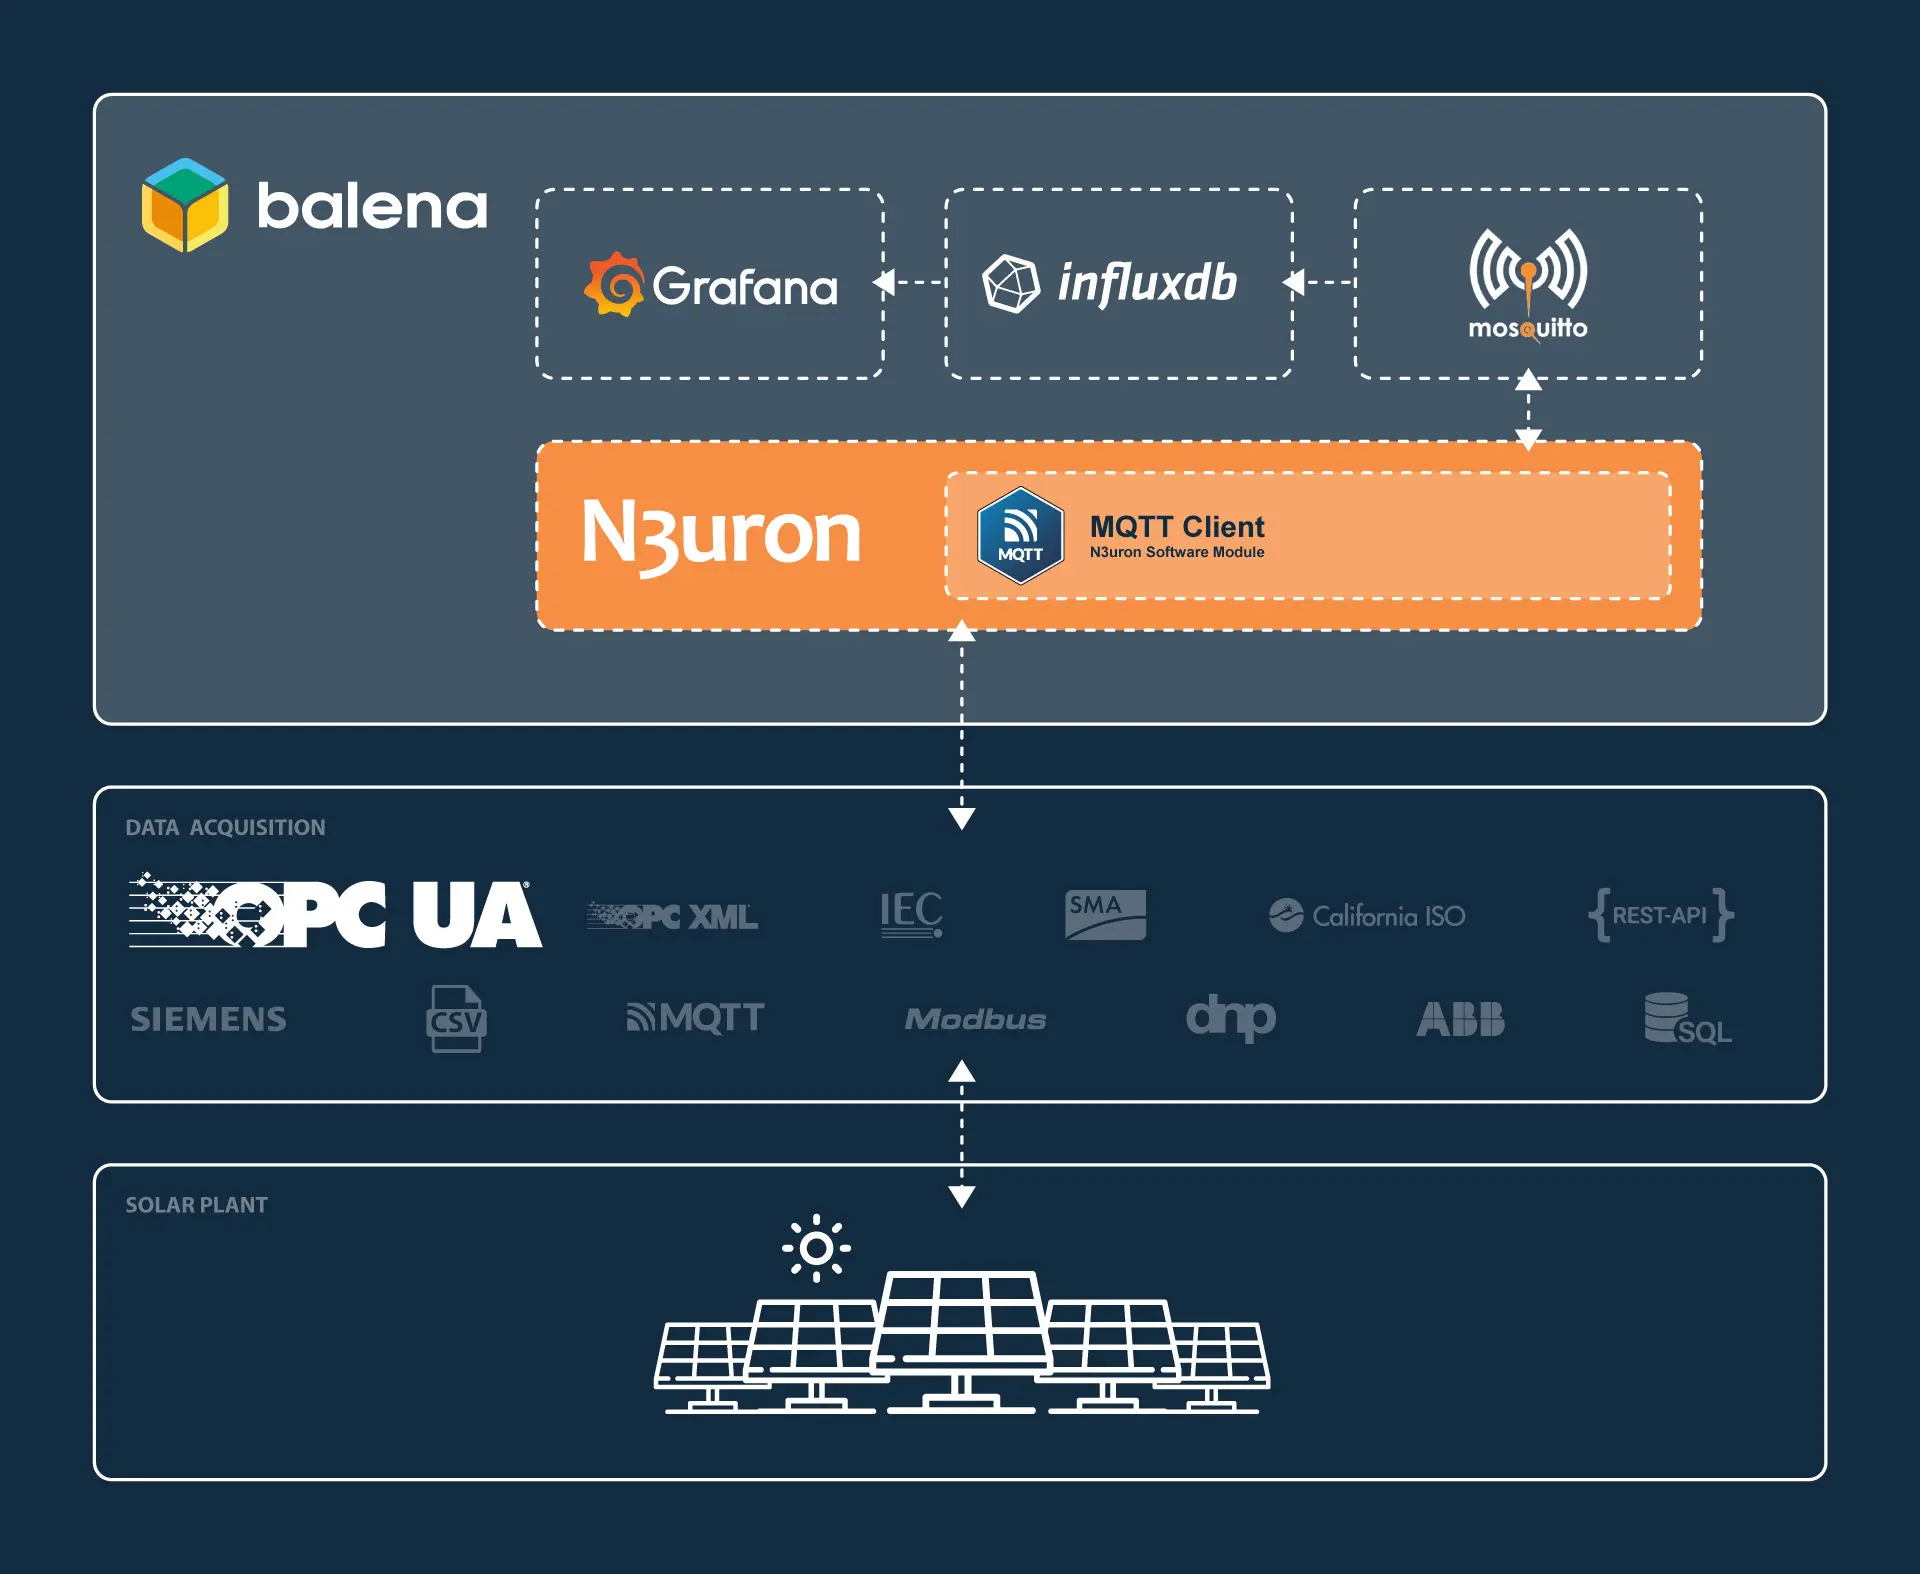
Infographic showing the Streamlined Data Management Process of MING Stack for Solar Plant Data Acquisition with OPC UA Protocol, N3uron MQTT Client Module, Mosquitto, InfluxDB, Grafana, and balena.
We have also drastically simplified the deployment process compared to our previous post. Now Telegraf (responsible for subscribing to the MQTT topics and inserting data into InfluxDB) and InfluxDB work out-of-the-box without any additional steps or configurations.
As you will see for yourself, the resulting solution is easier to manage, operate and scale to address organizations’ data challenges than other legacy solutions on the market.
The addition of N3uron to the MING stack provides several advantages including:
- The ability to adapt and scale in complex and growing environments.
- Lightweight and powerful edge computing capabilities.
- Secure communications, modern authentication strategies, user auditing, and control over system access to safeguard data and applications.
- Built-in tools for remote control, data visualization and analysis, provided by modules such as Web Vision and Historian.
- Templates, which allow for rapid building of complex data structures and communication configurations which help drastically reduce the amount of required work for deployments.
- The licensing model is server-based and unlimited, allowing for easy deployment of unlimited web clients, tags, connections, and devices.
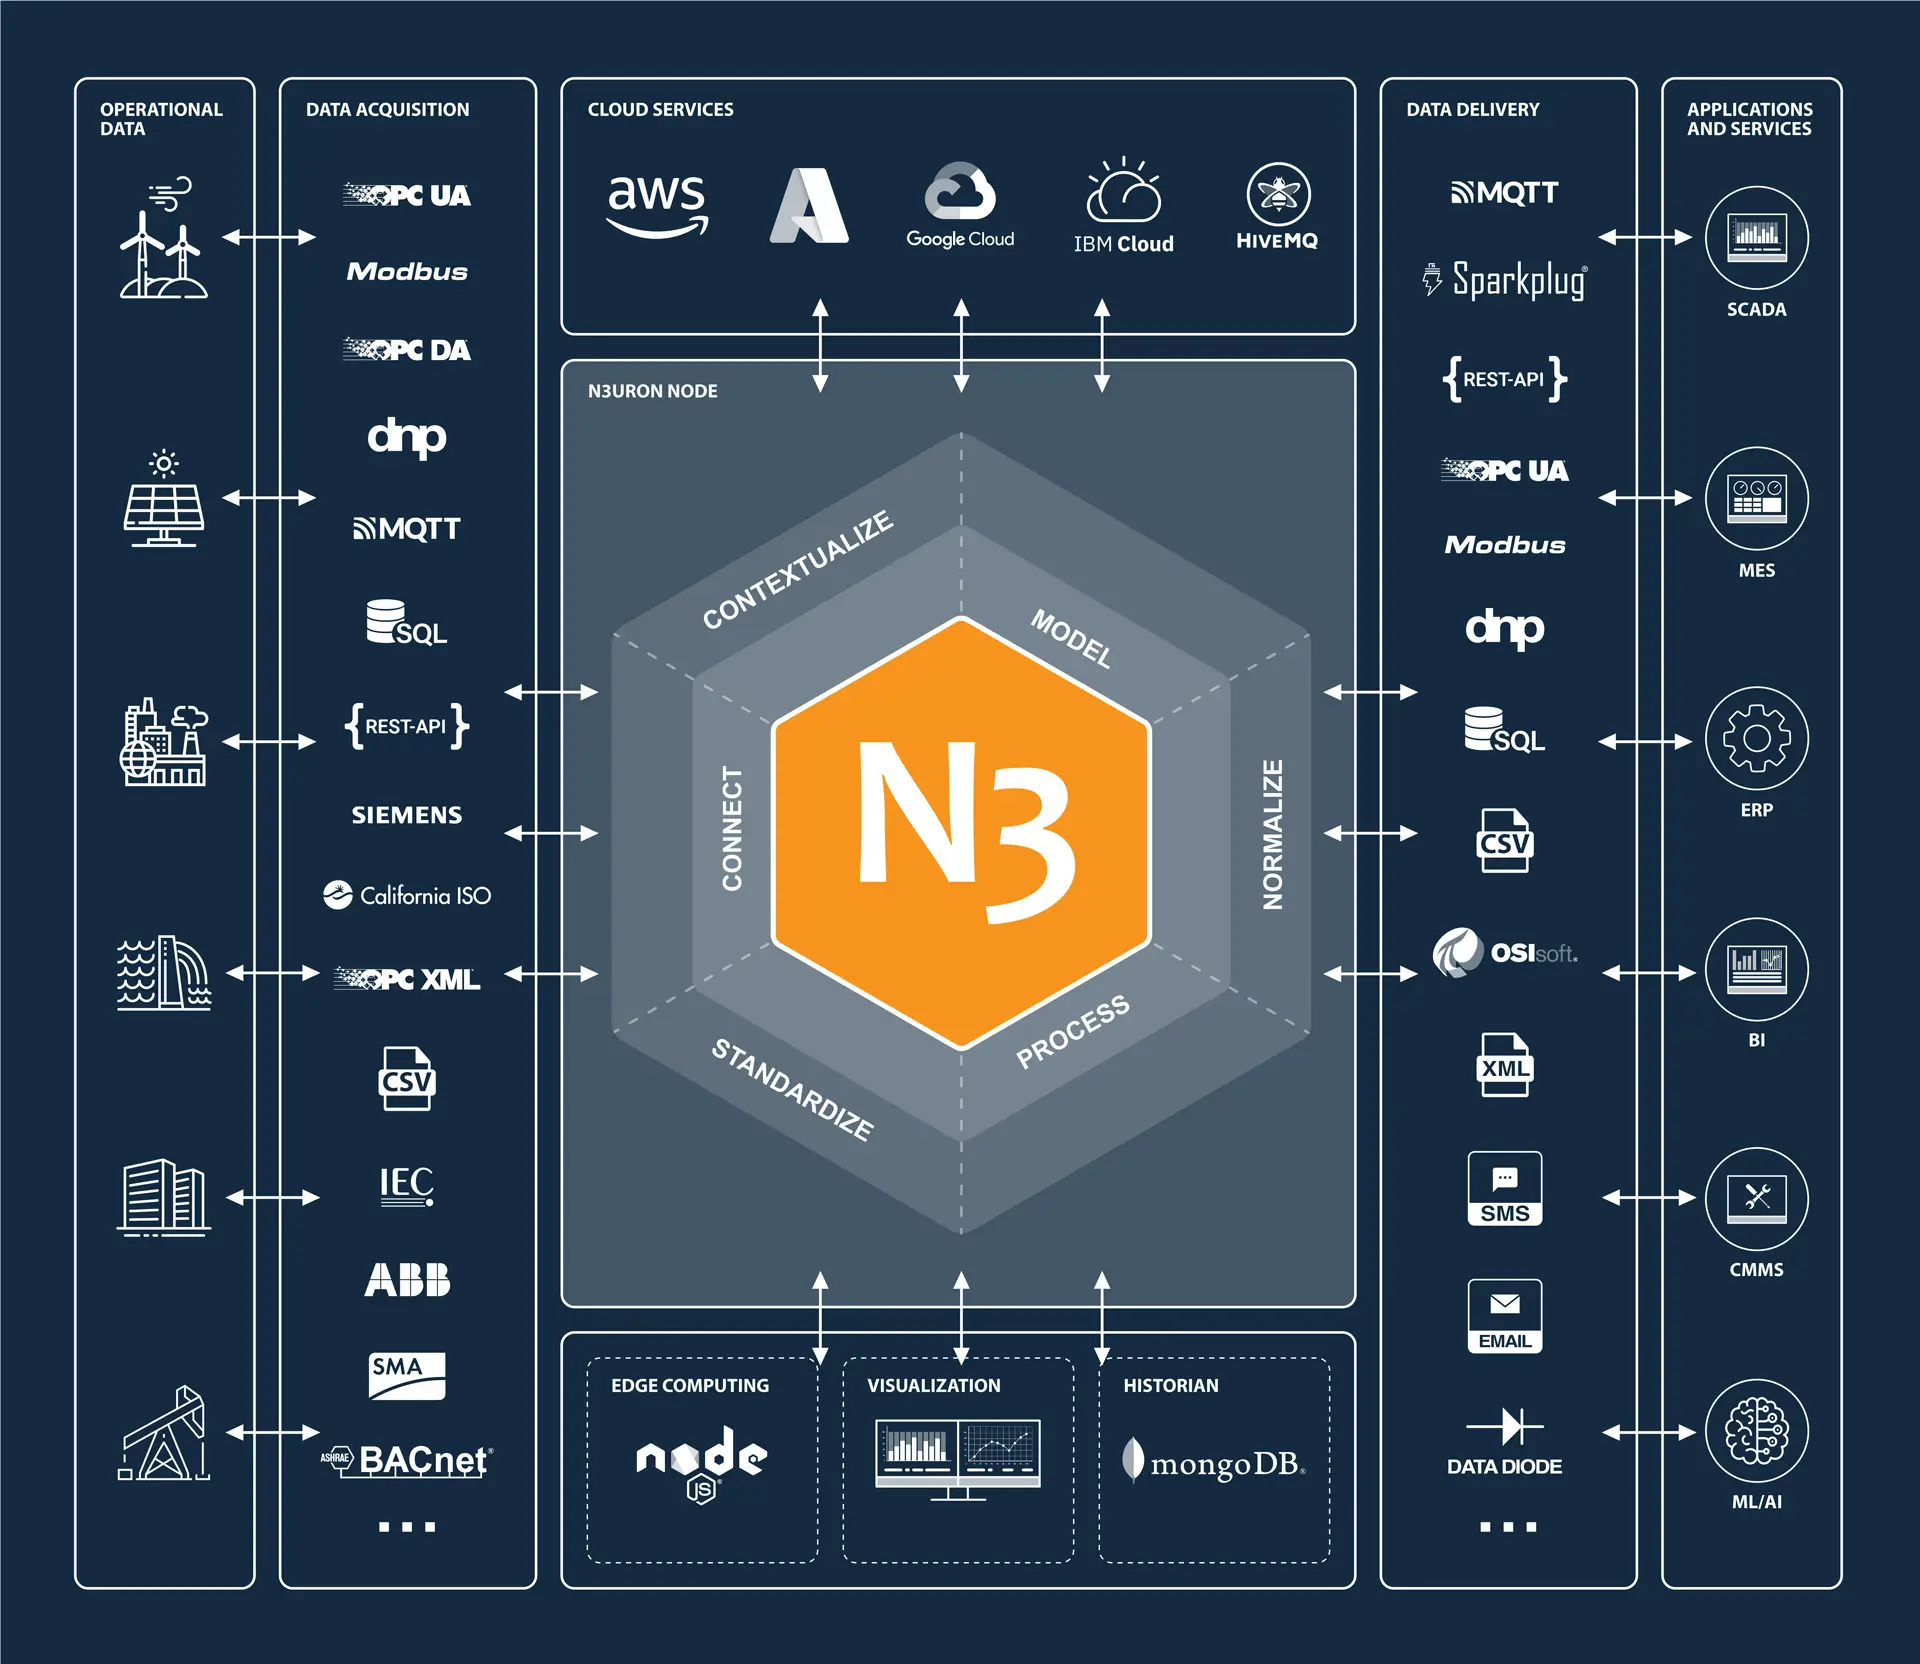
Infographic depicting N3uron platform’s main features in operational data, data acquisition, delivery modules, applications, cloud services, edge computing, visualization, and historian functionalities.
By leveraging the capabilities of all these technologies working together, businesses can unlock new insights and efficiencies in their operations. Some potential use cases for the MING stack include:
- Real-time monitoring and analysis of industrial equipment and processes.
- Integration of industrial data with enterprise systems for business intelligence and decision-making.
- Energy management and optimization for industrial facilities.
- Remote monitoring and control of distributed assets.
- Integration of legacy industrial systems with modern data platforms.
- Quality control and assurance for manufacturing processes.
- Environmental monitoring and compliance reporting.
- Predictive maintenance and anomaly detection for industrial machinery.
- Asset tracking and inventory management.
Alike in the previous post, once you have completed the configuration steps outlined in the following sections, you will have a fully functional proof of concept with real-time data streaming from a Photovoltaic Plant located in Italy. The data, received through a remote OPC UA Server, will flow seamlessly through your local N3uron instance and be displayed on your Grafana dashboard.
Deploy MING with balena
Deploy from balenaHub (Recommended)
BalenaHub is a marketplace that offers ready-to-deploy applications for large device fleets. With just a few clicks, it is possible to deploy and manage these applications centrally using balenaCloud.
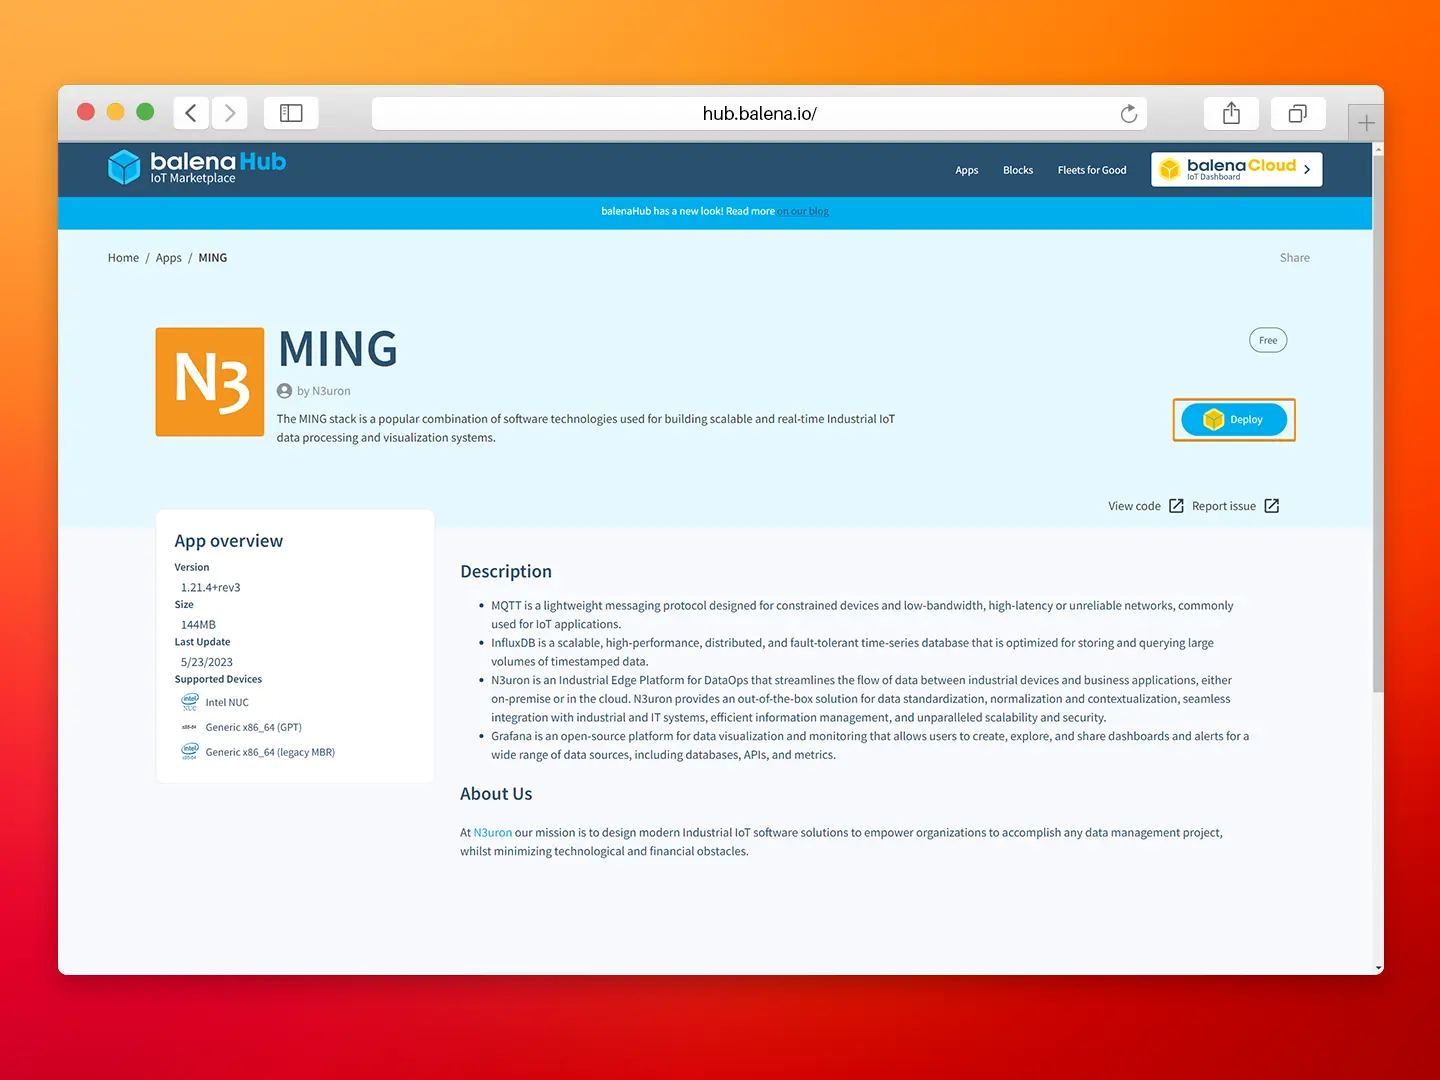
Image displaying N3uron MING Stack from balena Hub web page.
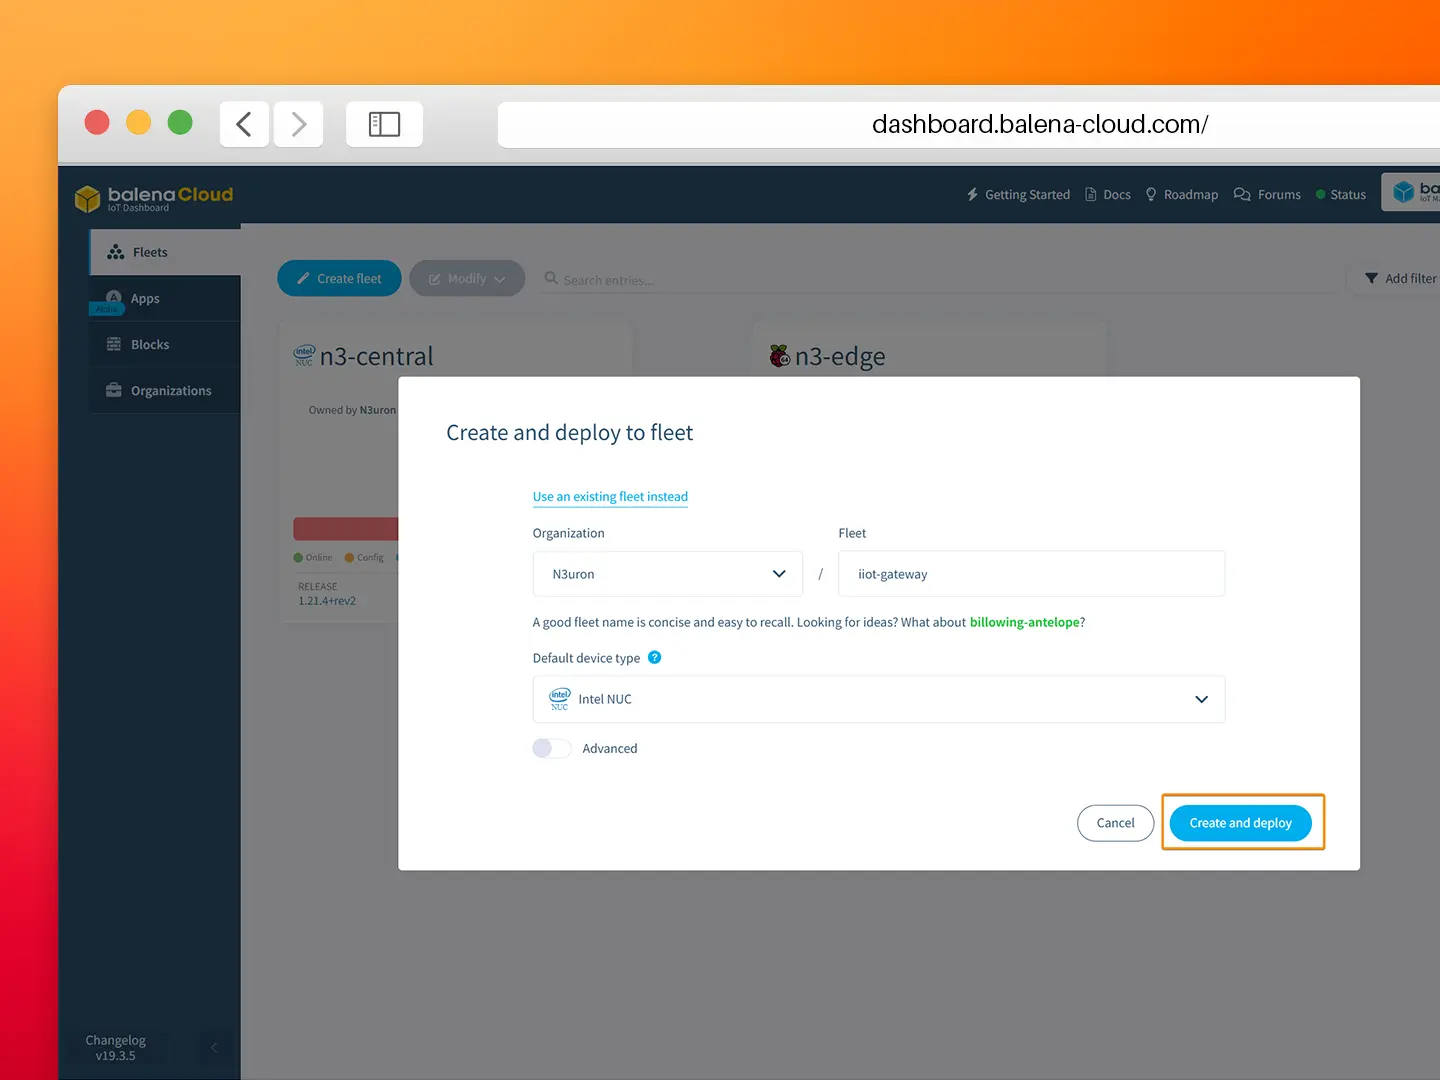
- Step 1: To deploy the N3uron application, simply visit https://hub.balena.io/apps/2047510/MING and click on the Deploy button. You will then be prompted to log in to your balenaCloud account. Once logged in, you can choose to deploy the app to either a new or an existing fleet.
Screenshot of the balena Cloud panel for creating and deploying to a fleet N3uron.
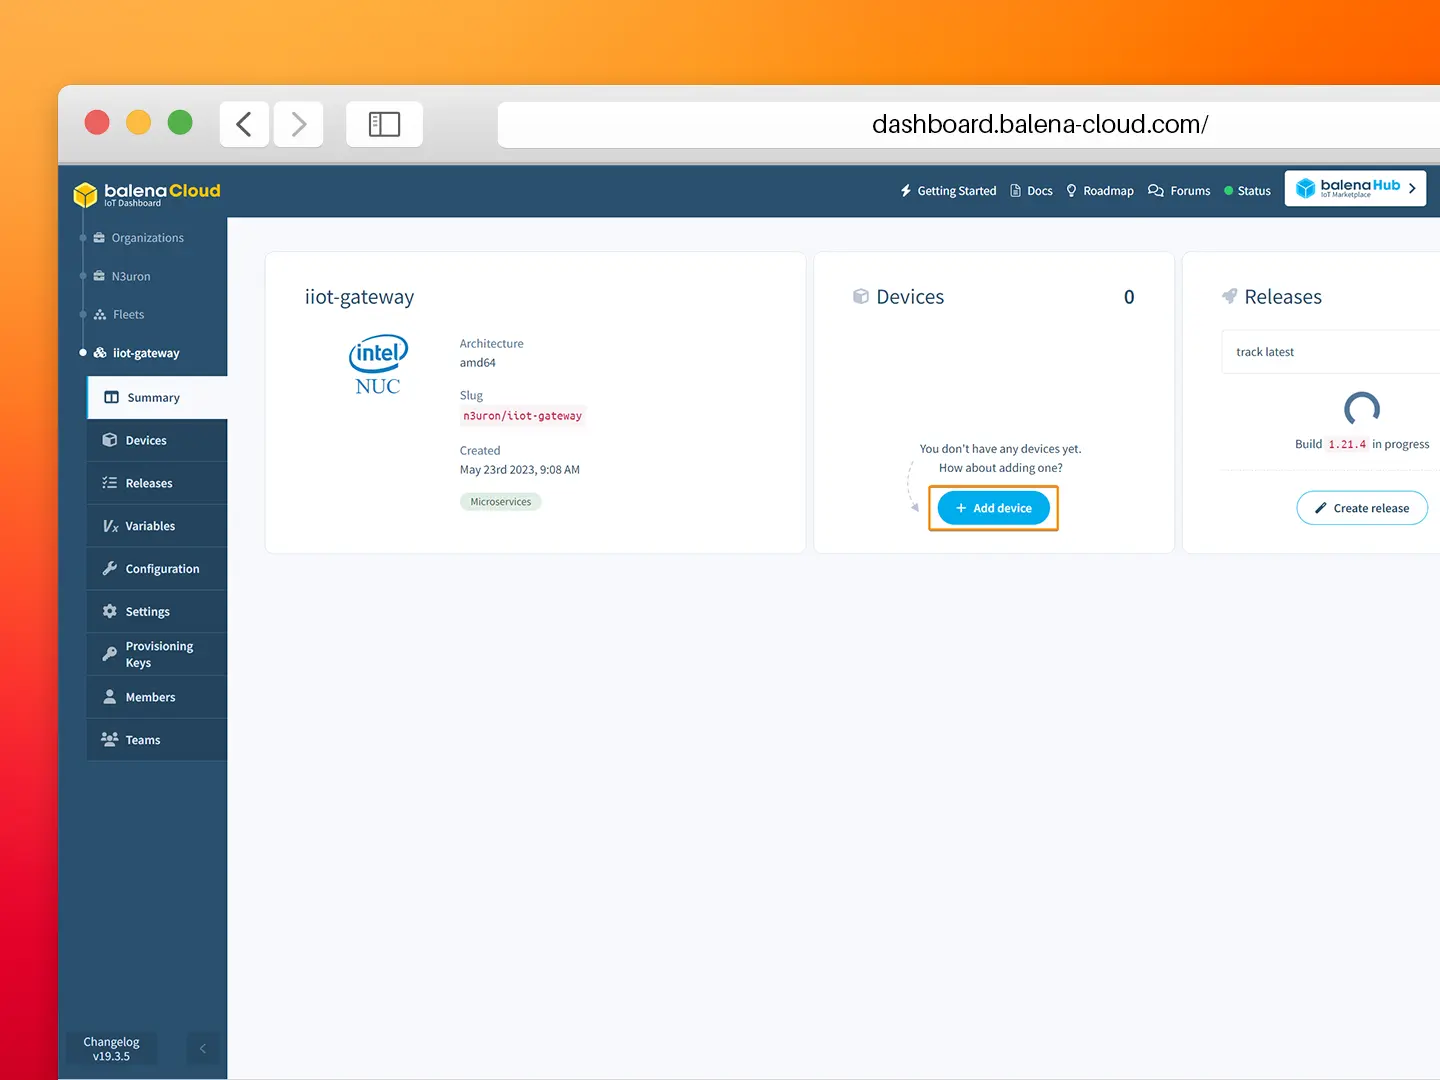
- Step 2: Click on Add device.
Image showing the balena Cloud summary panel for adding N3uron IIoT Gateway Device.
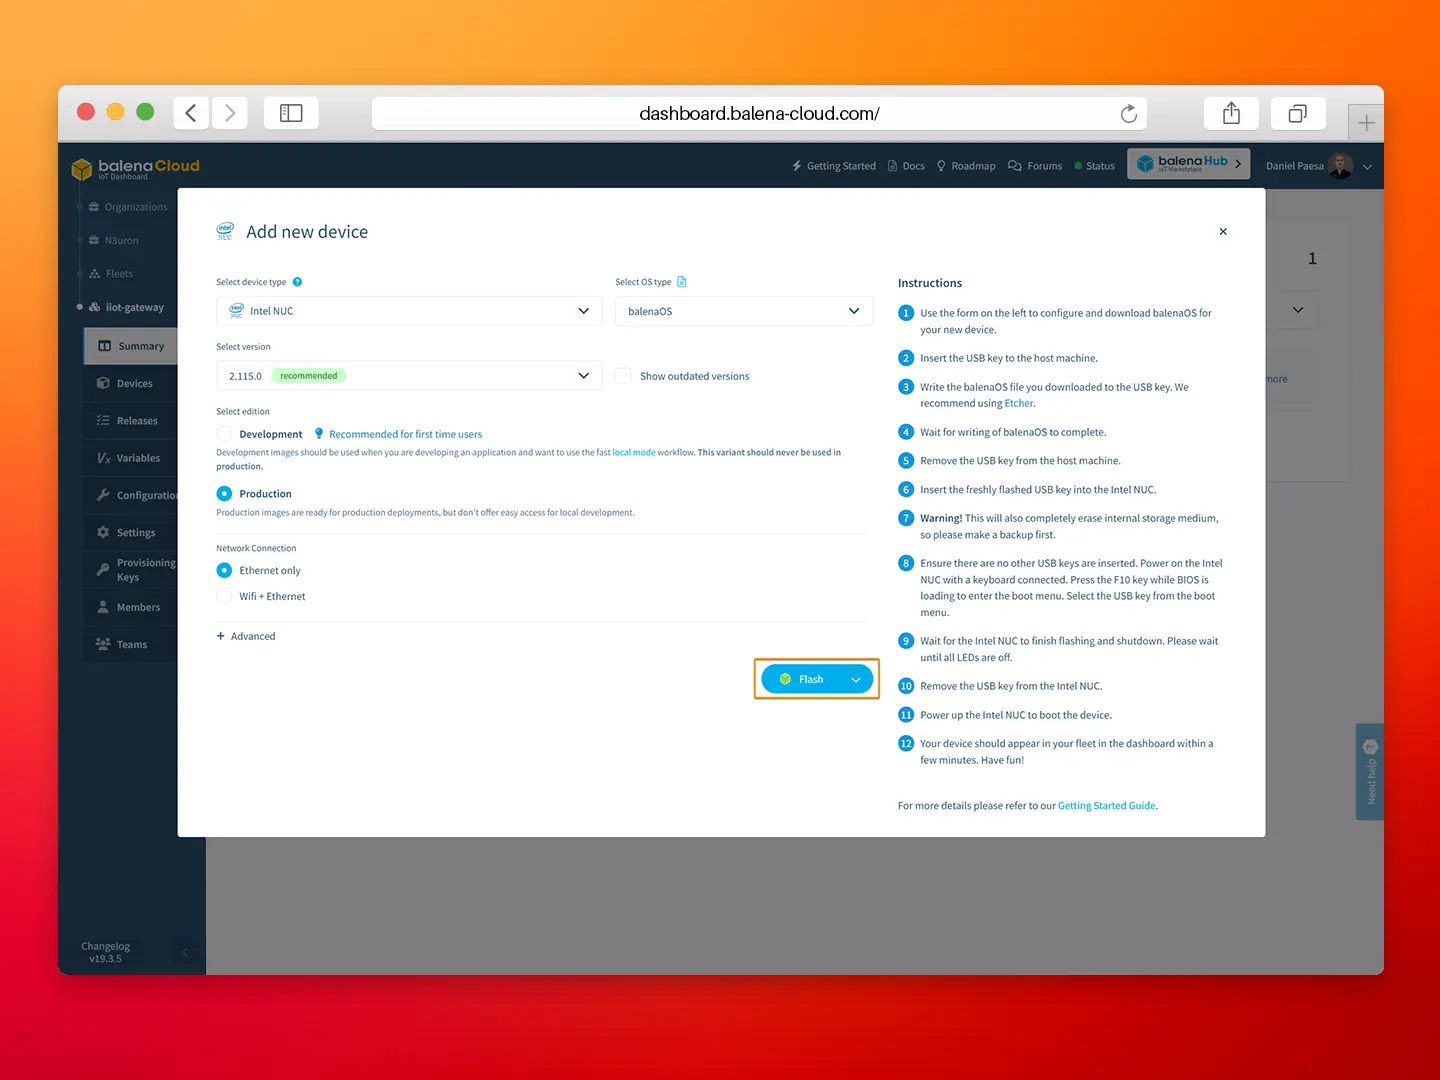
- Step 3: Configure the new device and flash it with balenaEtcher, follow the step-by-step instructions from balena.
Image displaying the field for selecting the version in the “add new device” panel of balenaEtcher.
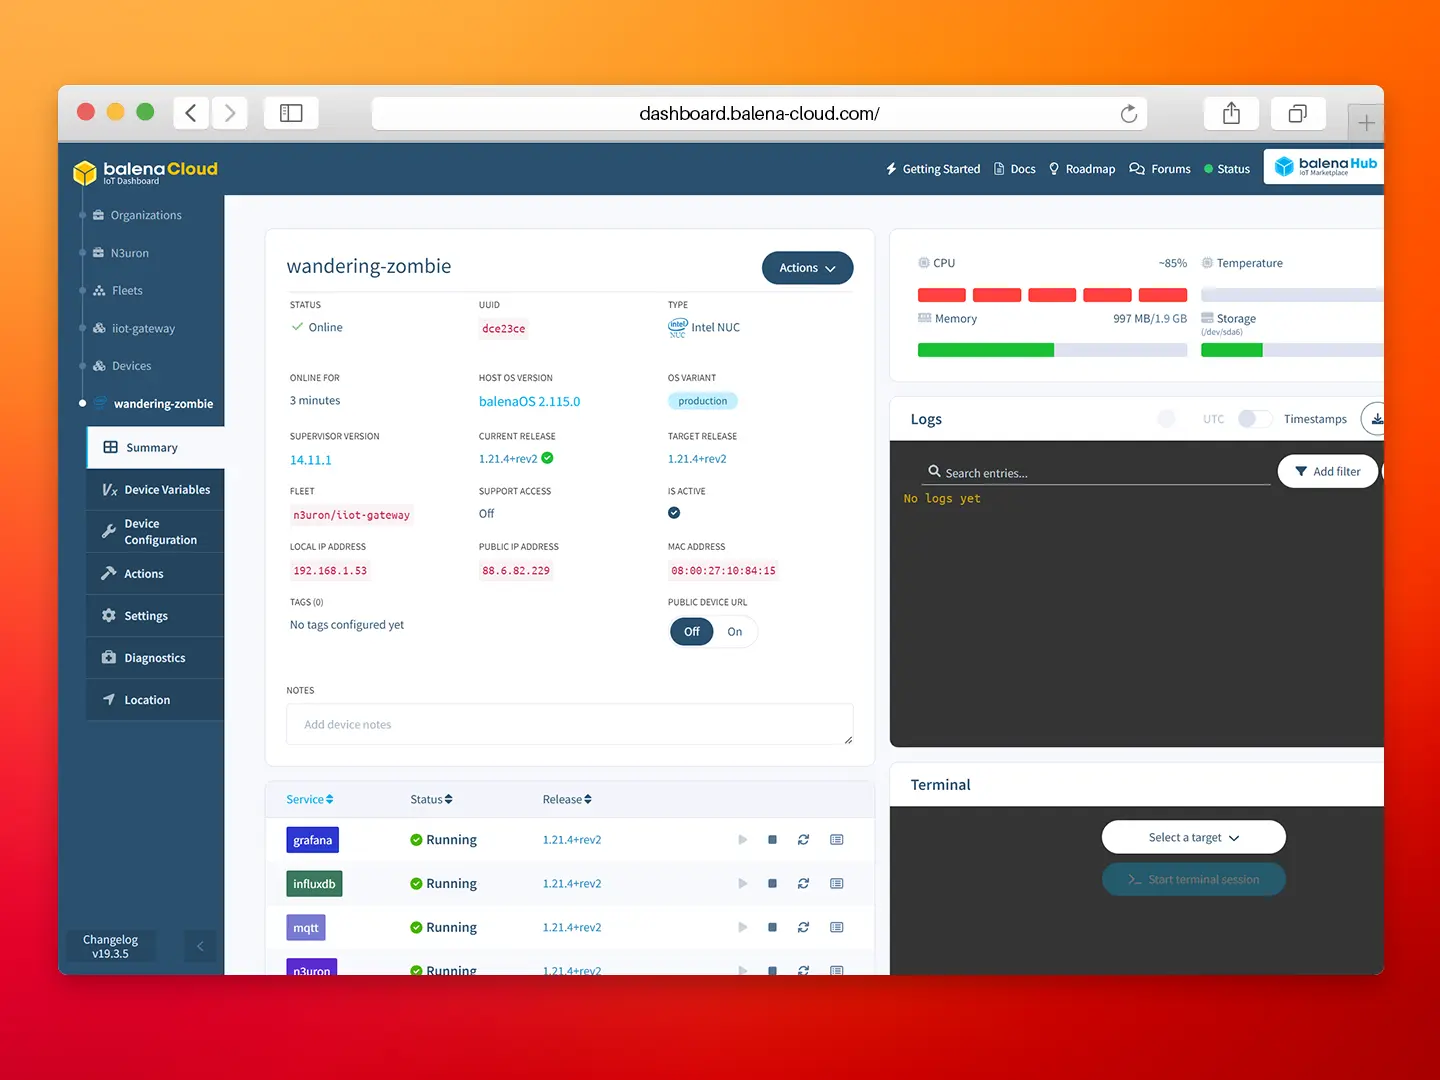
- Step 4: After powering up the device it’ll appear on your balenaCloud dashboard. All the services are automatically downloaded and launched by balena.
Image displaying Wandering Zombie Panel of balena Cloud.
Deploy from the Github repository (For advanced users)
If you are a balena CLI expert, feel free to use balena CLI. This option lets you configure in detail some aspects, like adding new services to your deploy or configure the existing but requires that you have both Git and the balena CLI installed on your system.
To do this, create an application in your balenaCloud dashboard, clone our repository, customize it to your needs and use the balena push command to deploy the stack to your fleet of devices.
git clone https://github.com/n3uron/ming-balena
cd ming-balena
balena login && balena push “fleet-name”
Configure N3uron
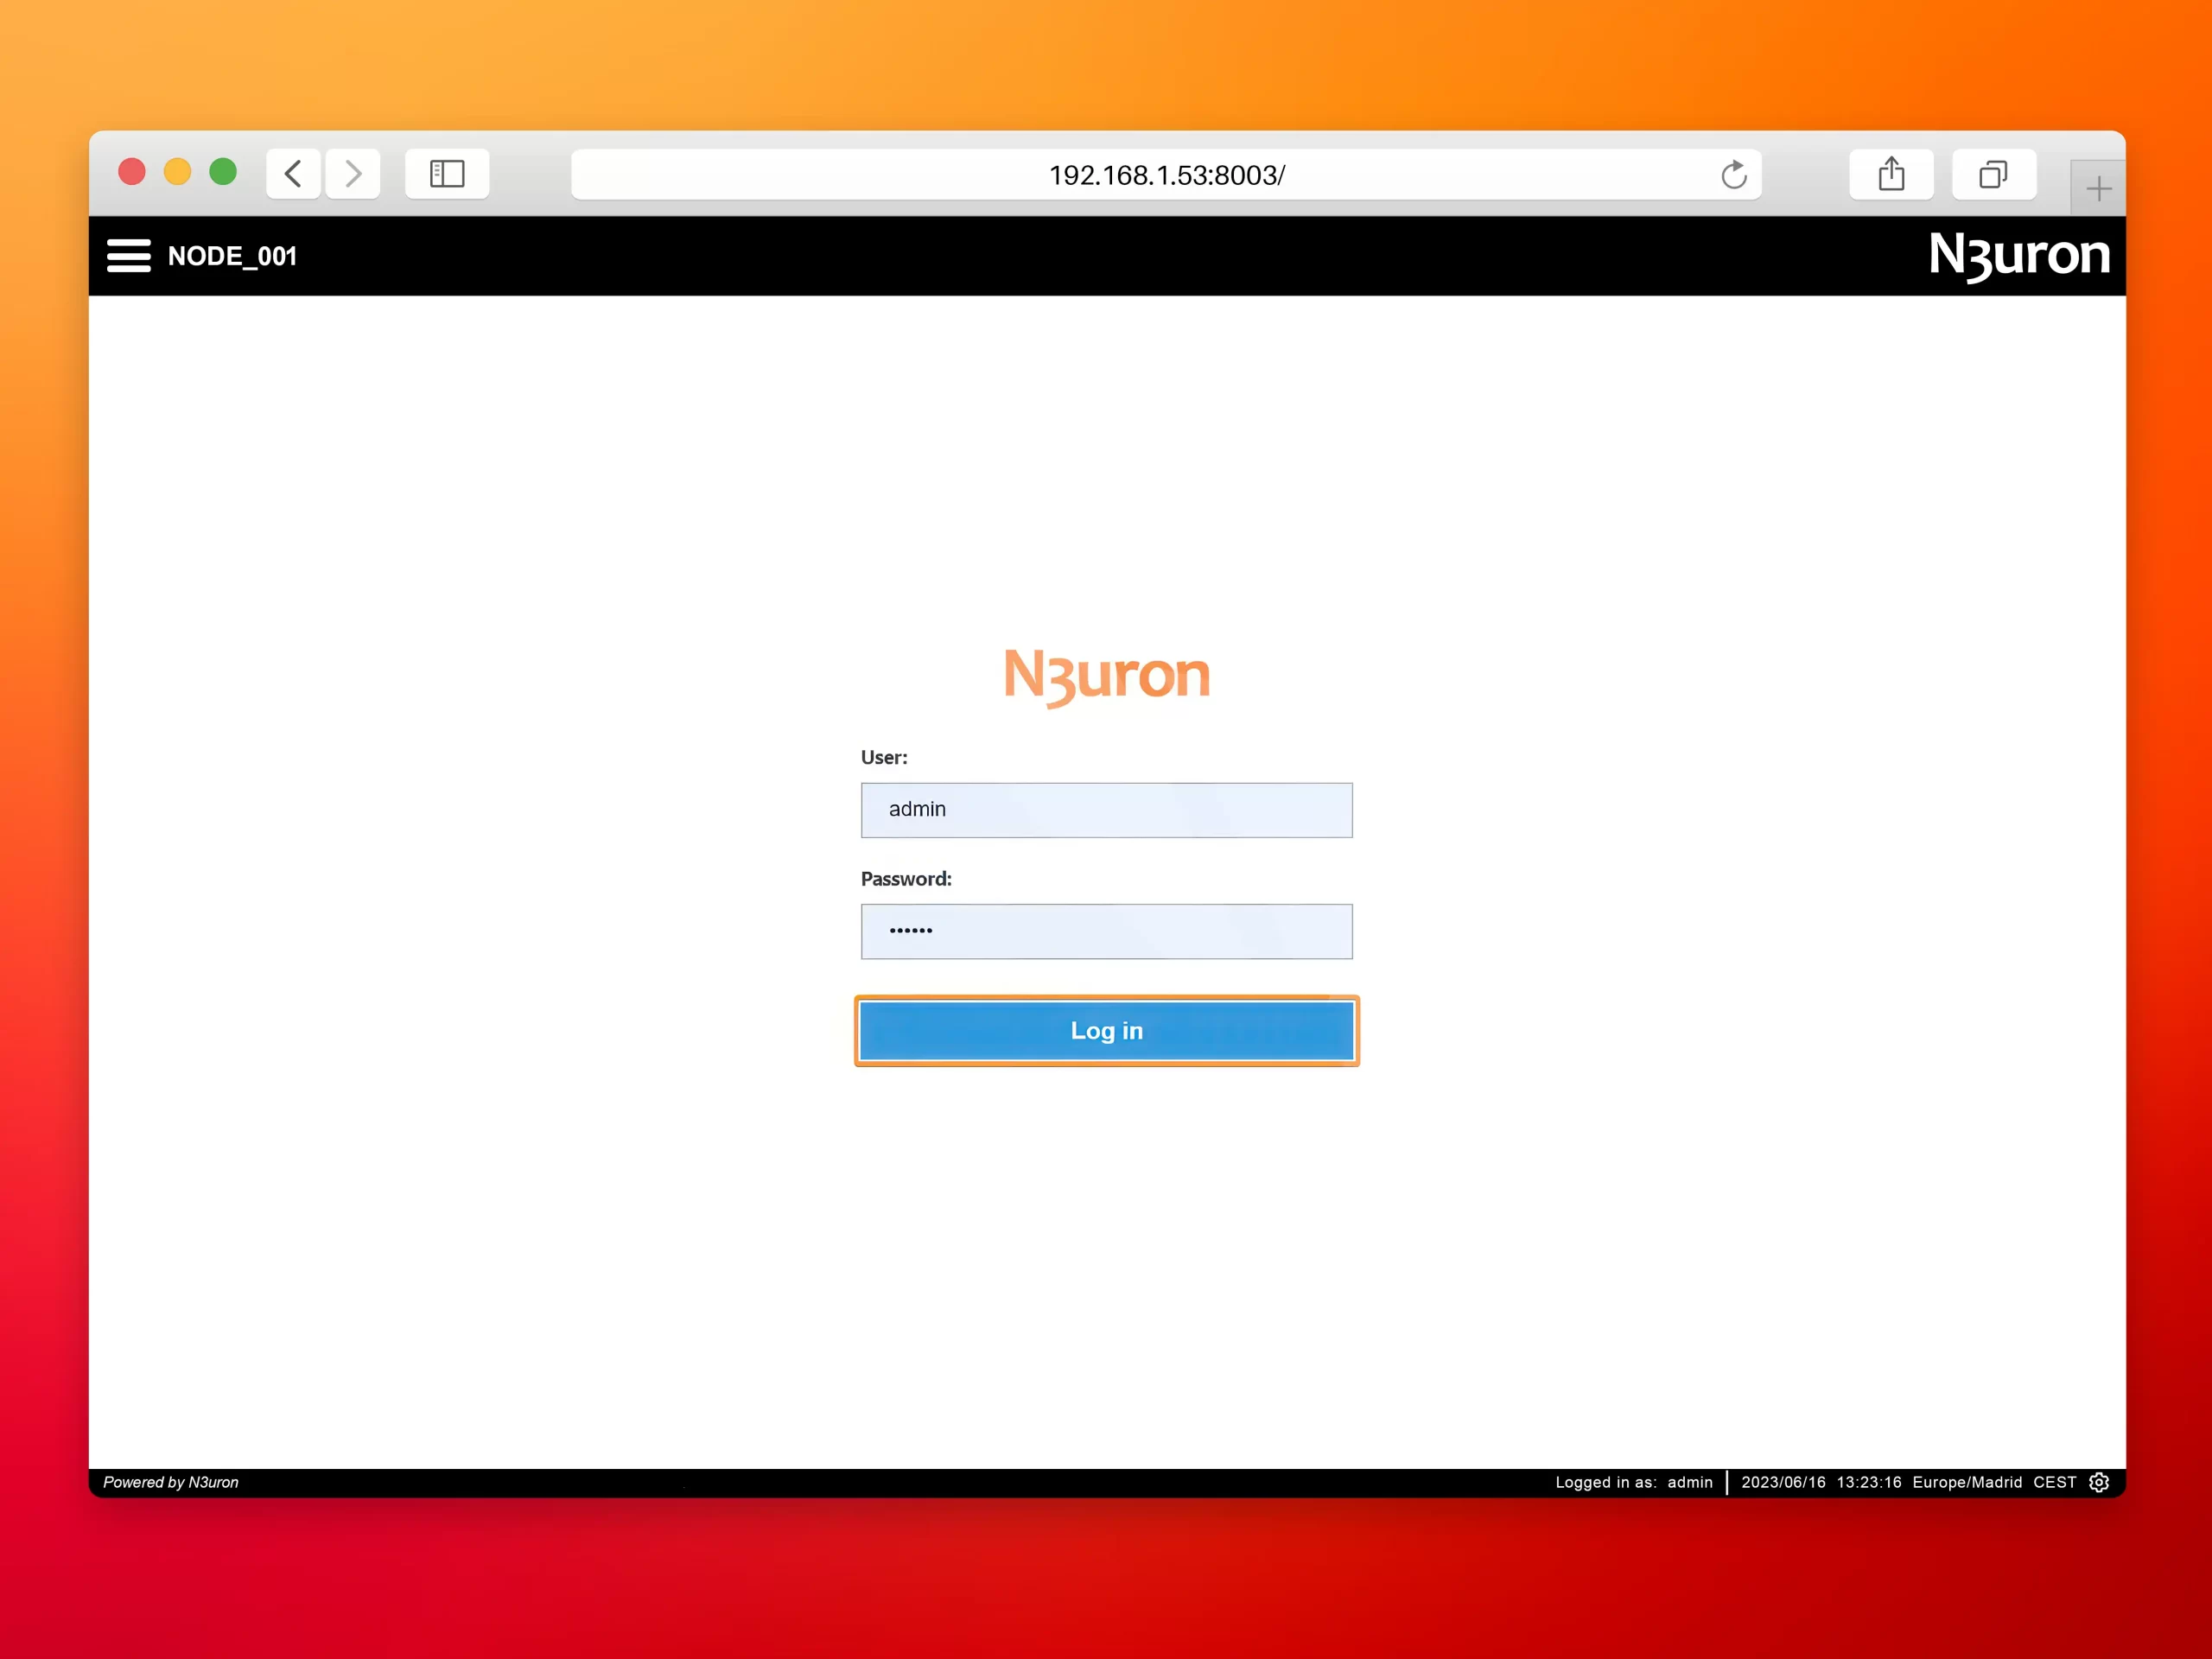
- Step 1: Open your web browser and go to http://
:8003 (in our case http://192.168.1.53:8003/) and login to N3uron’s WebUI.
– User: admin
– Password: n3uron
Image illustrating the login process to the N3uron web UI interface.
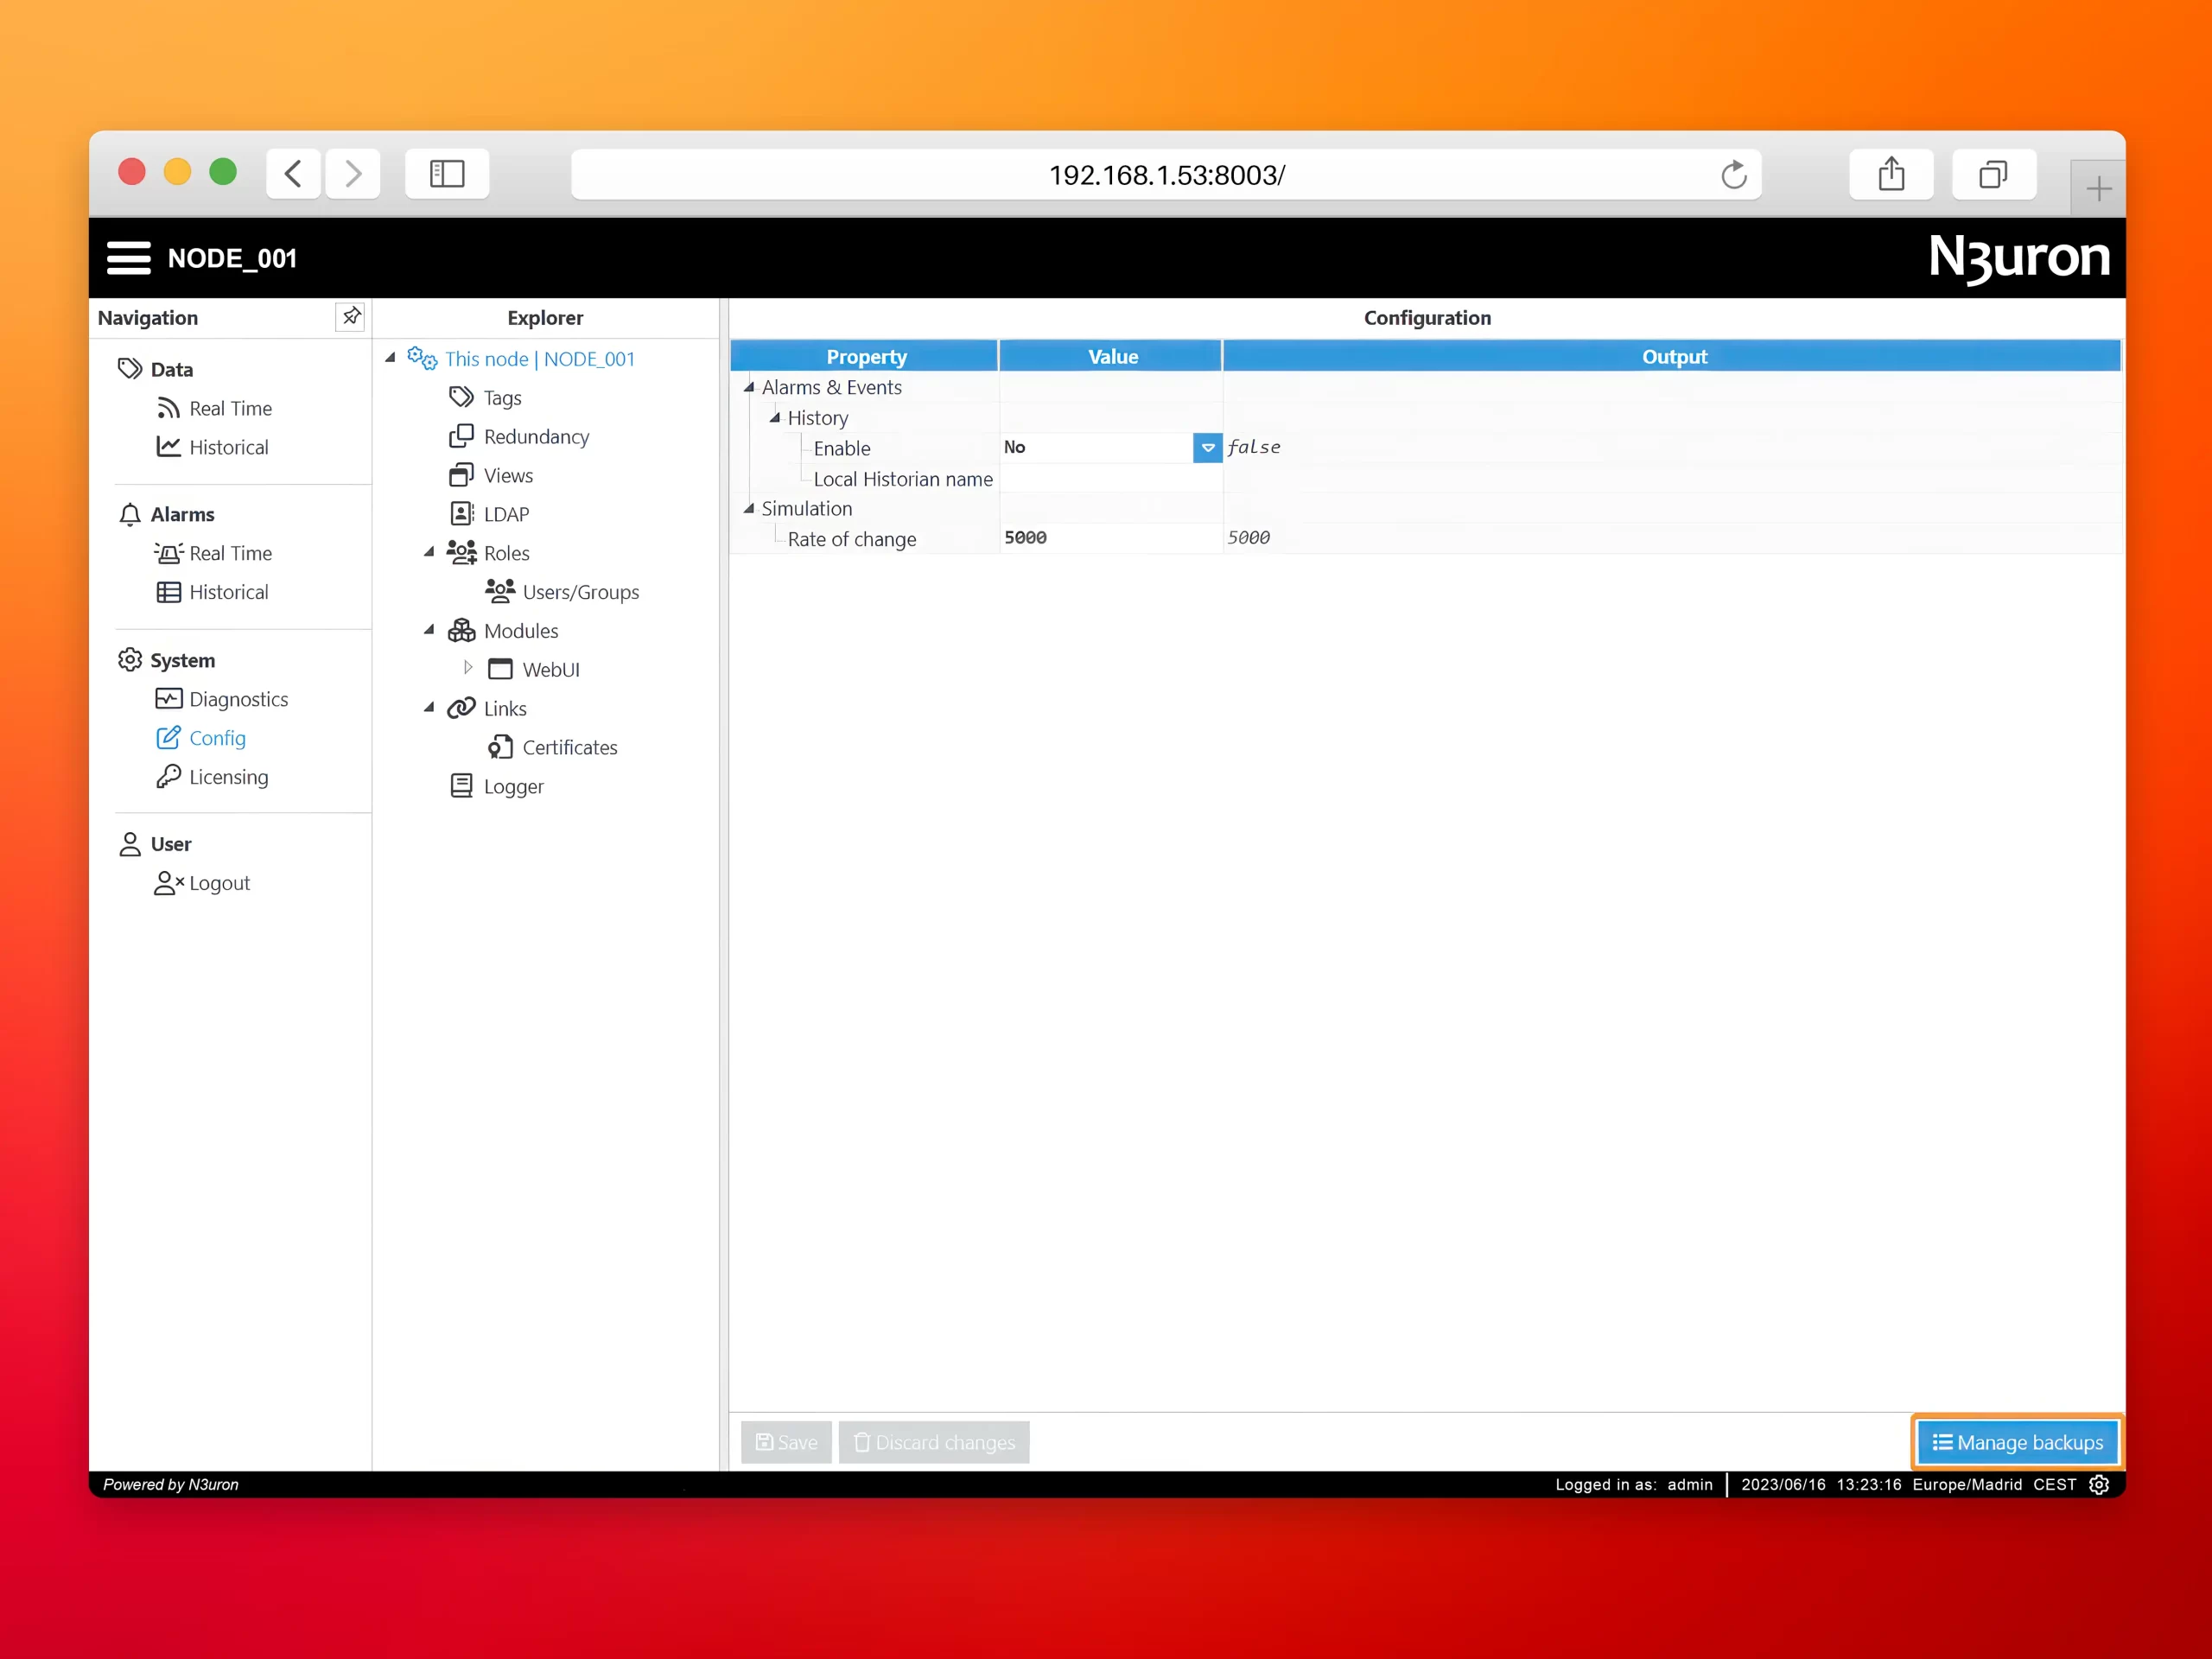
- Step 2: Navigate to the Config menu and click on Manage backups.
Image showcasing the management of backups through the N3uron WebUI interface for efficient backup operations.
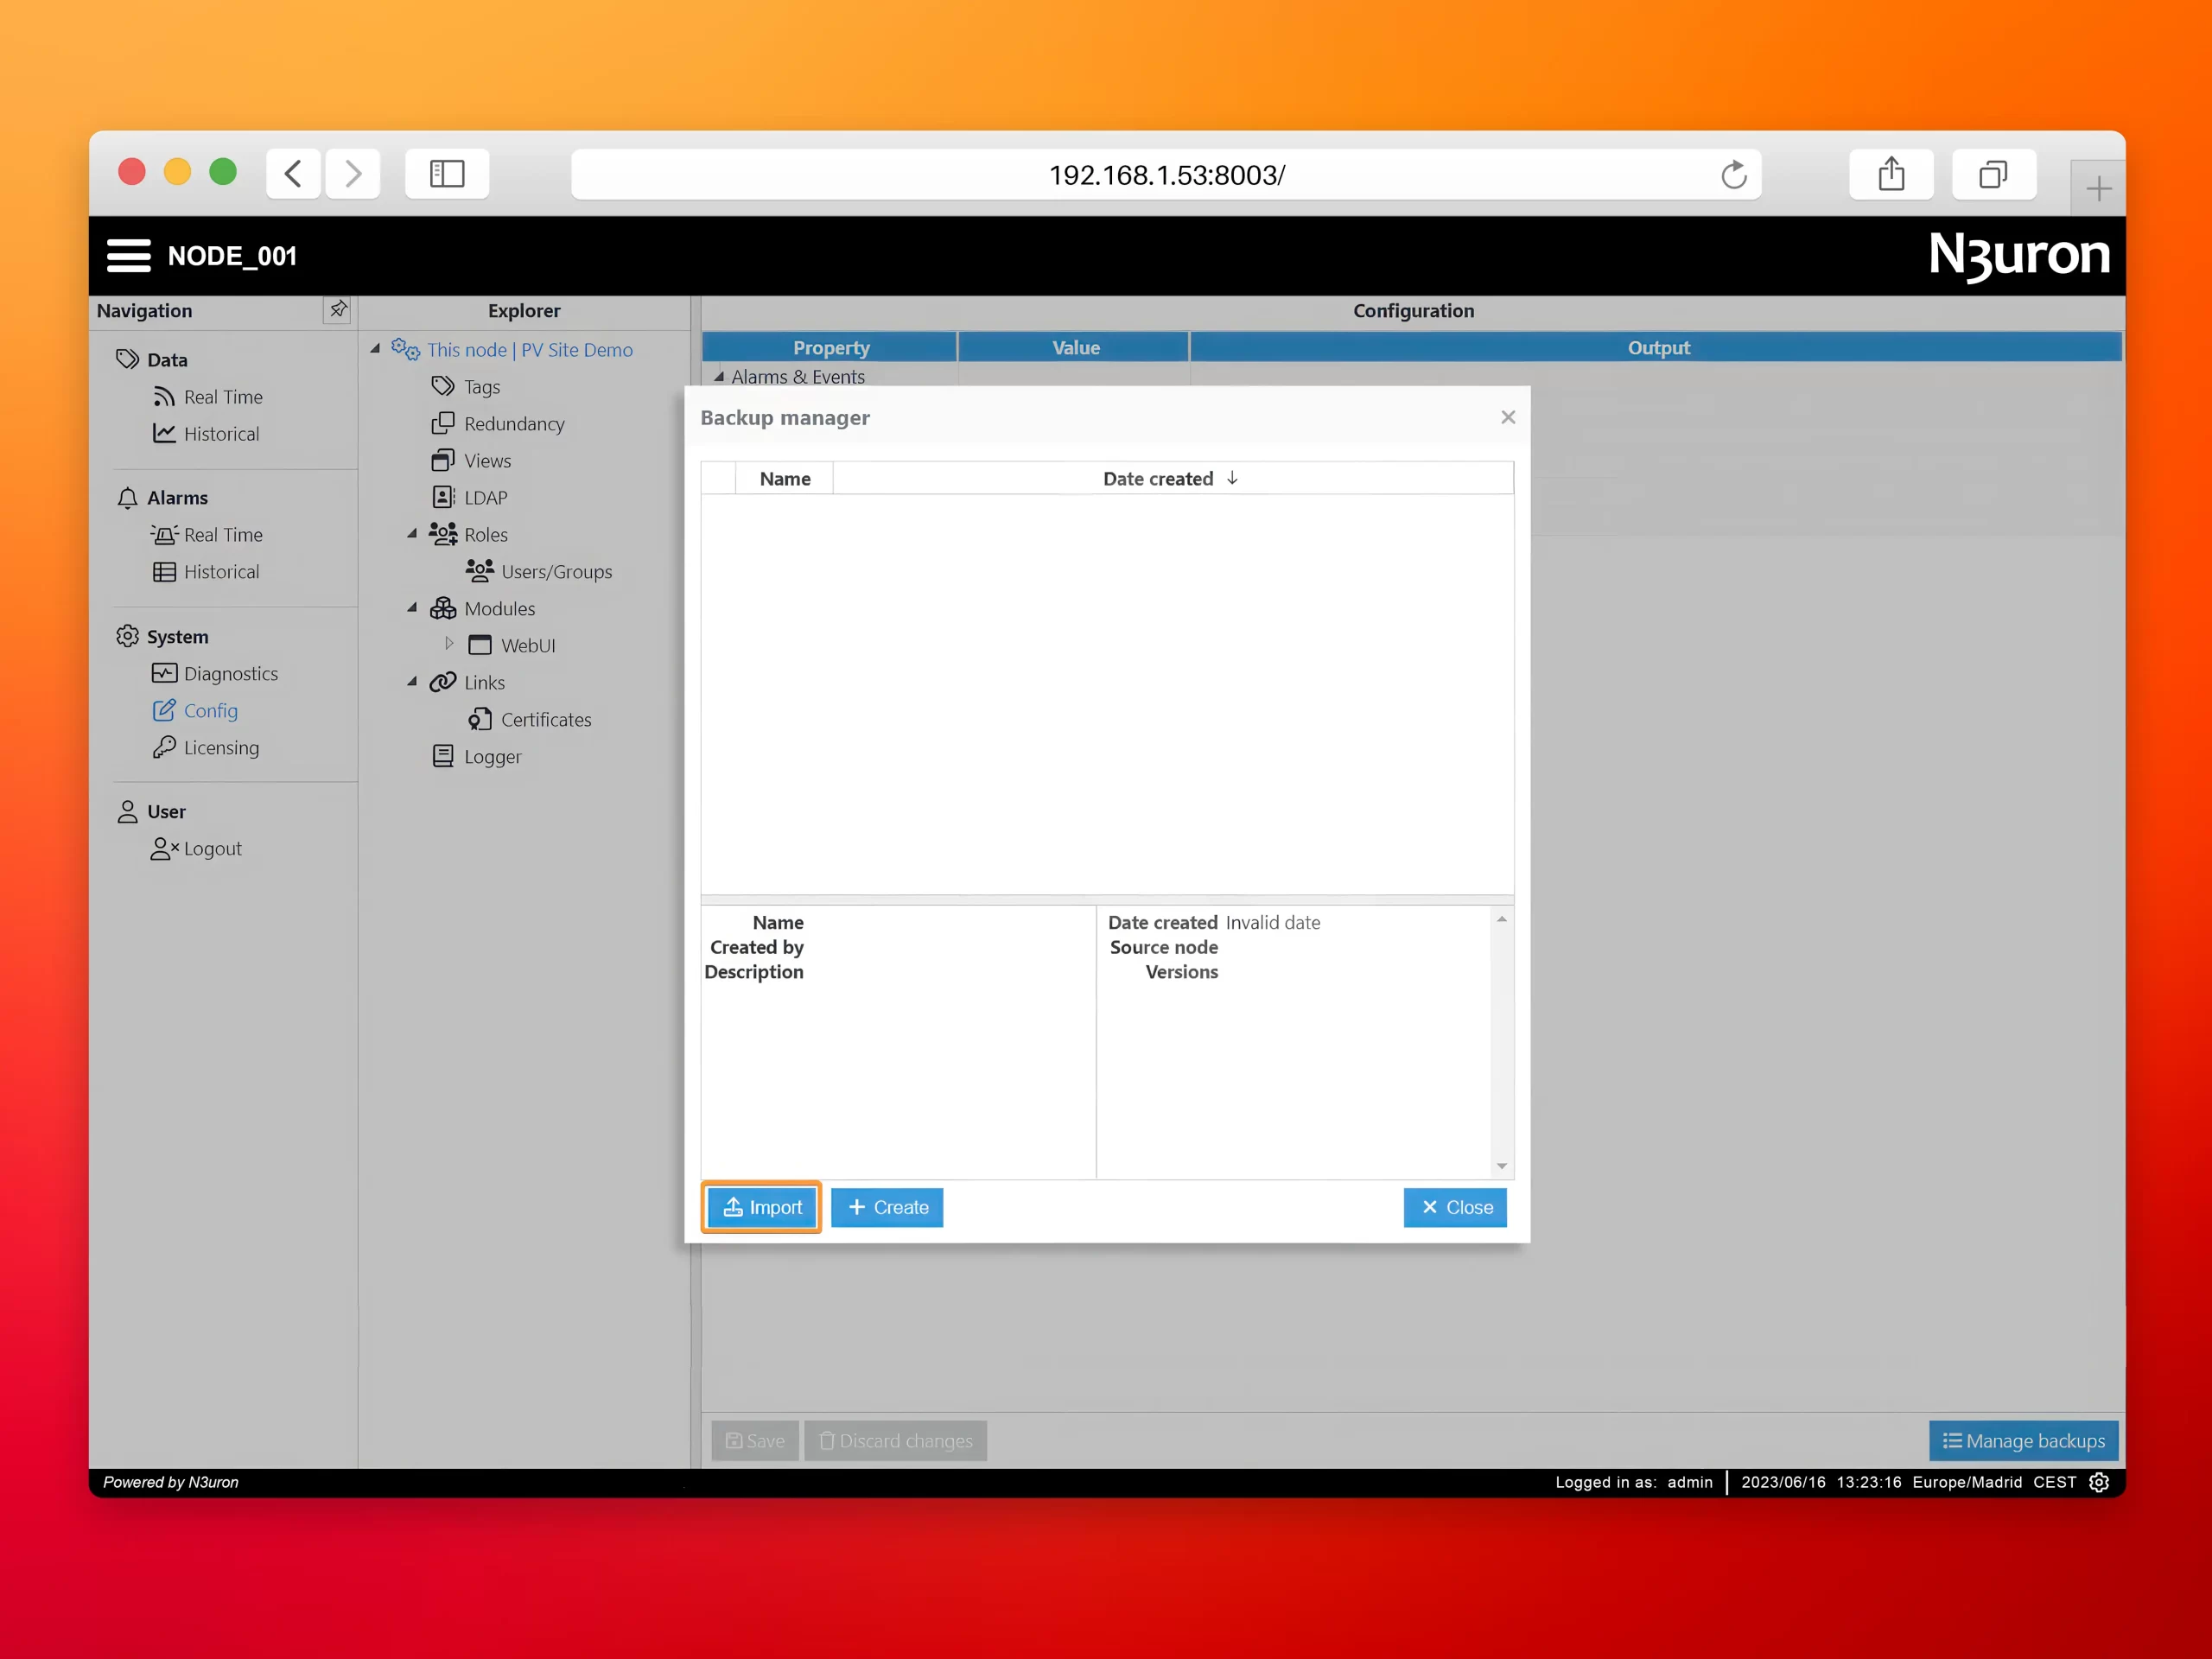
- Step 3: Download the N3uron backup file for this demo, click on Import and select the file.
The image displays the Backup Manager window of N3uron, illustrating the required steps for users to import their backup files.
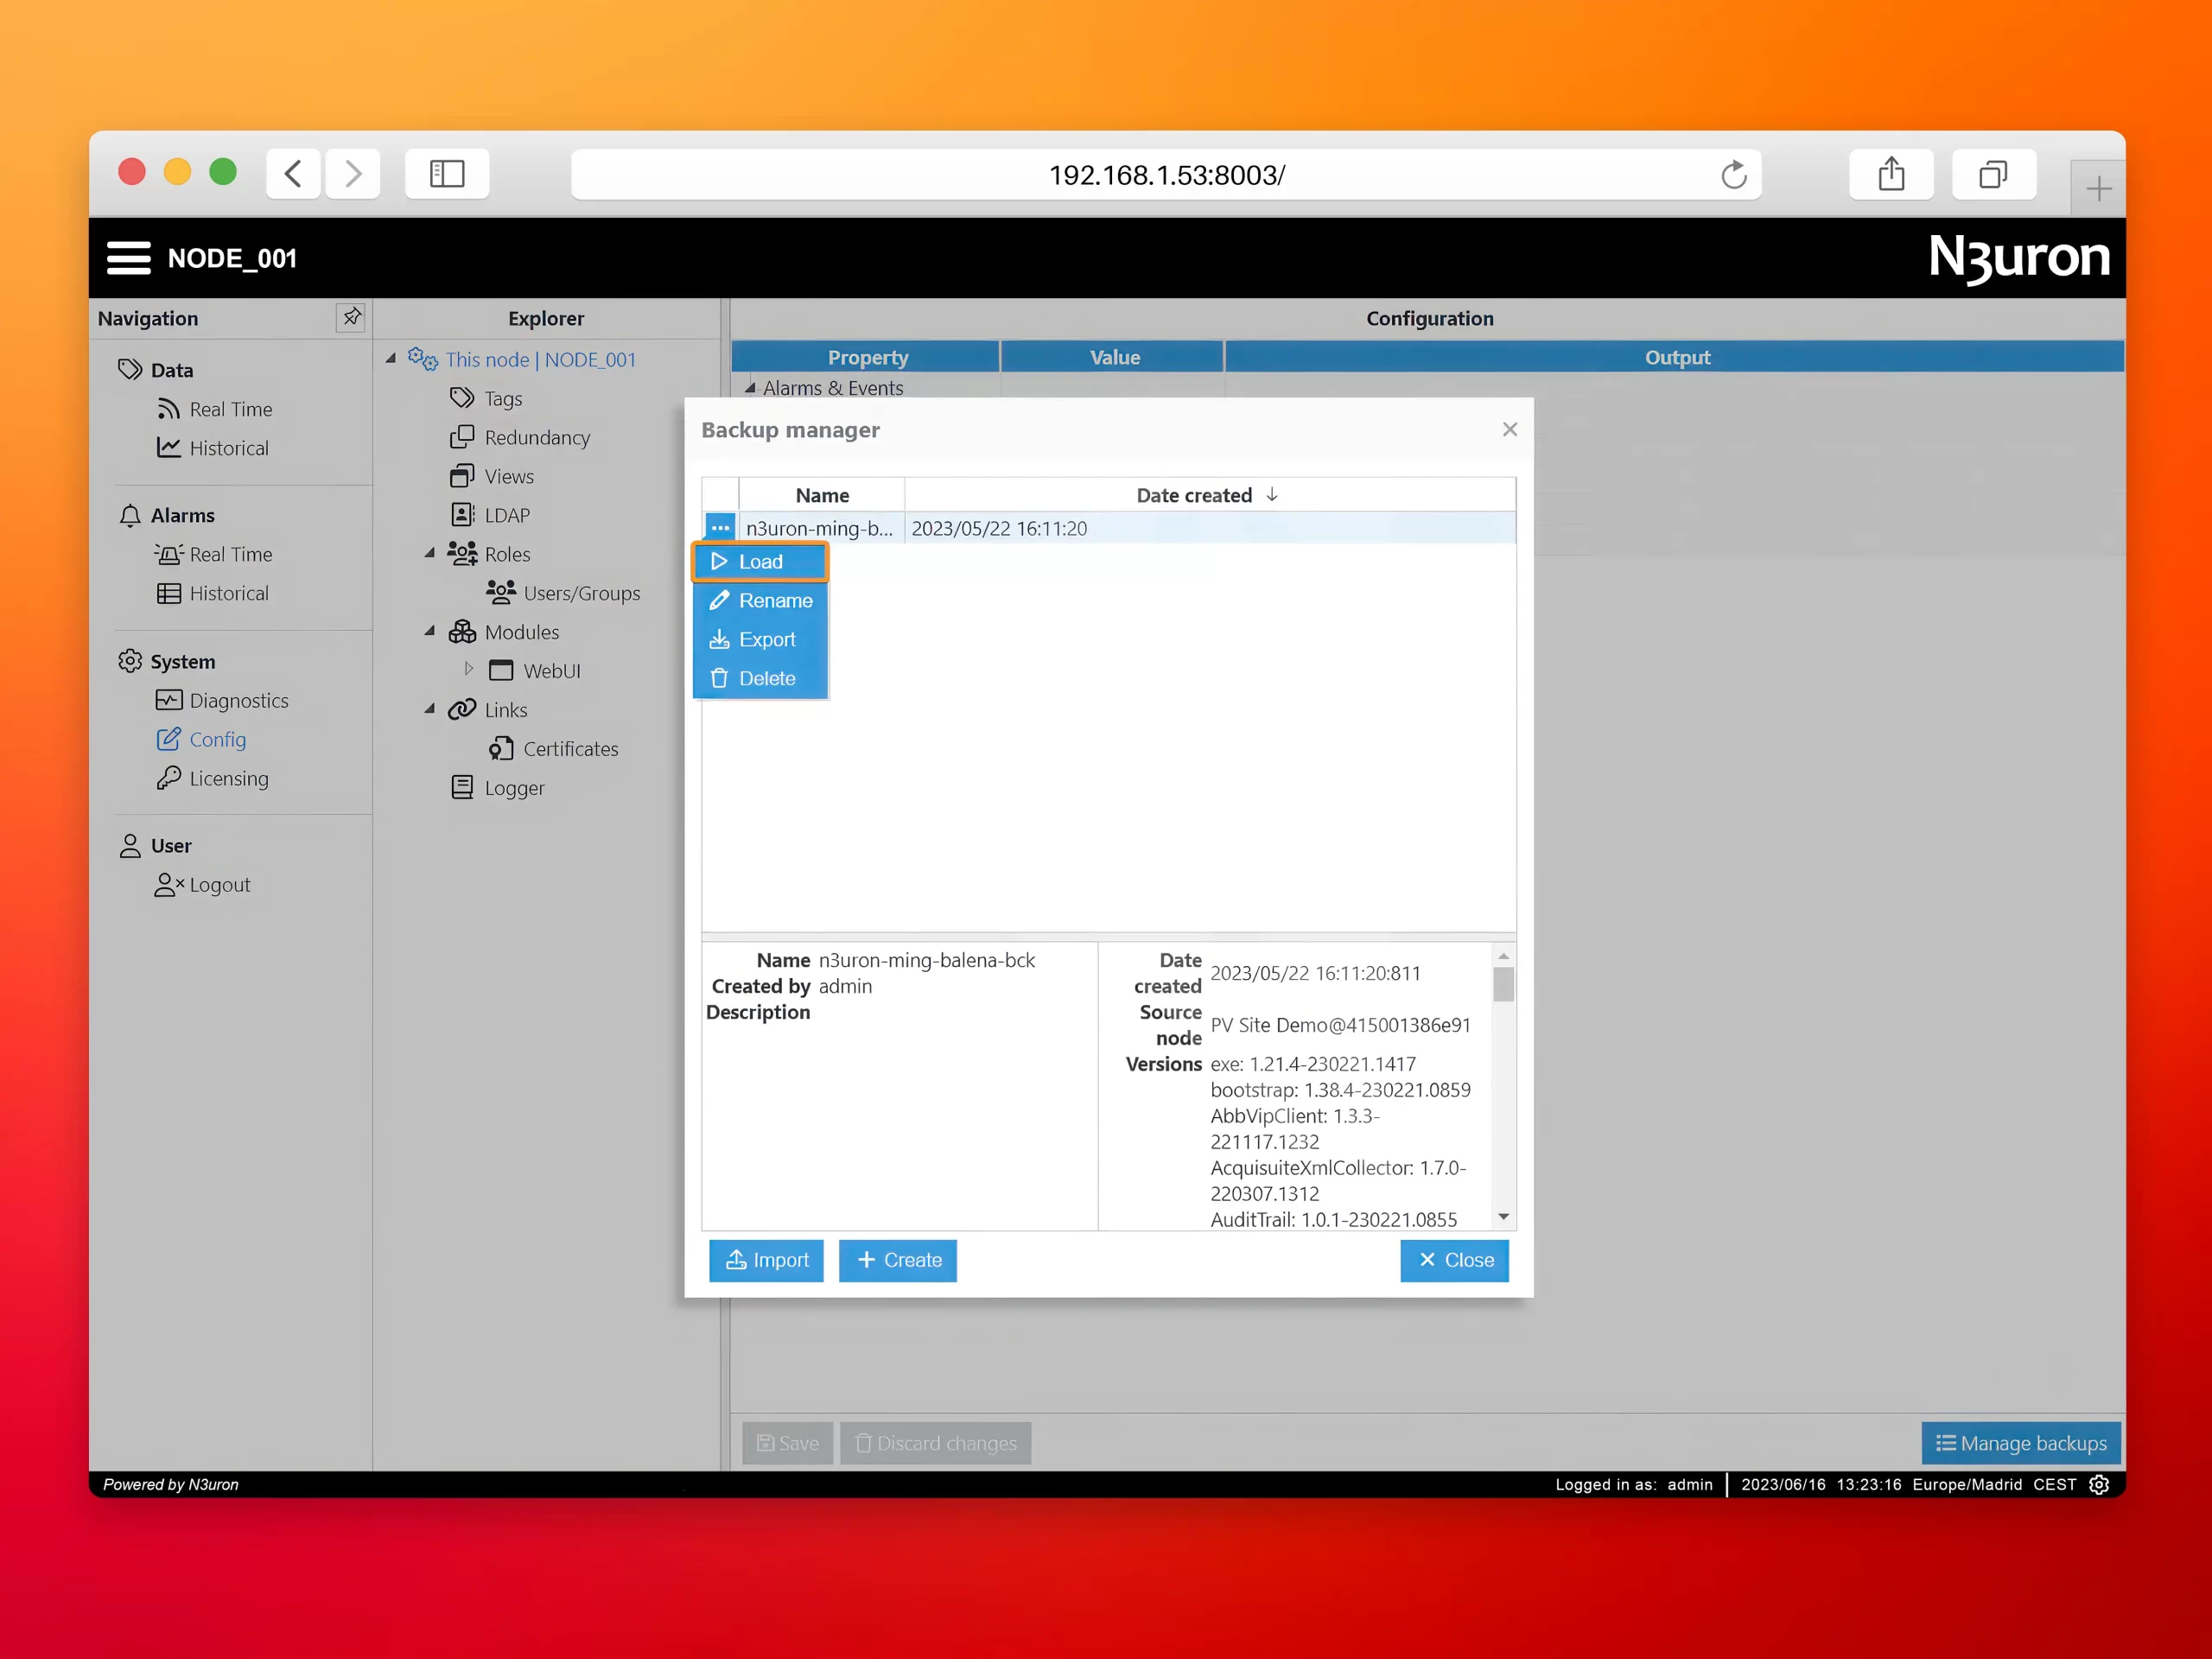
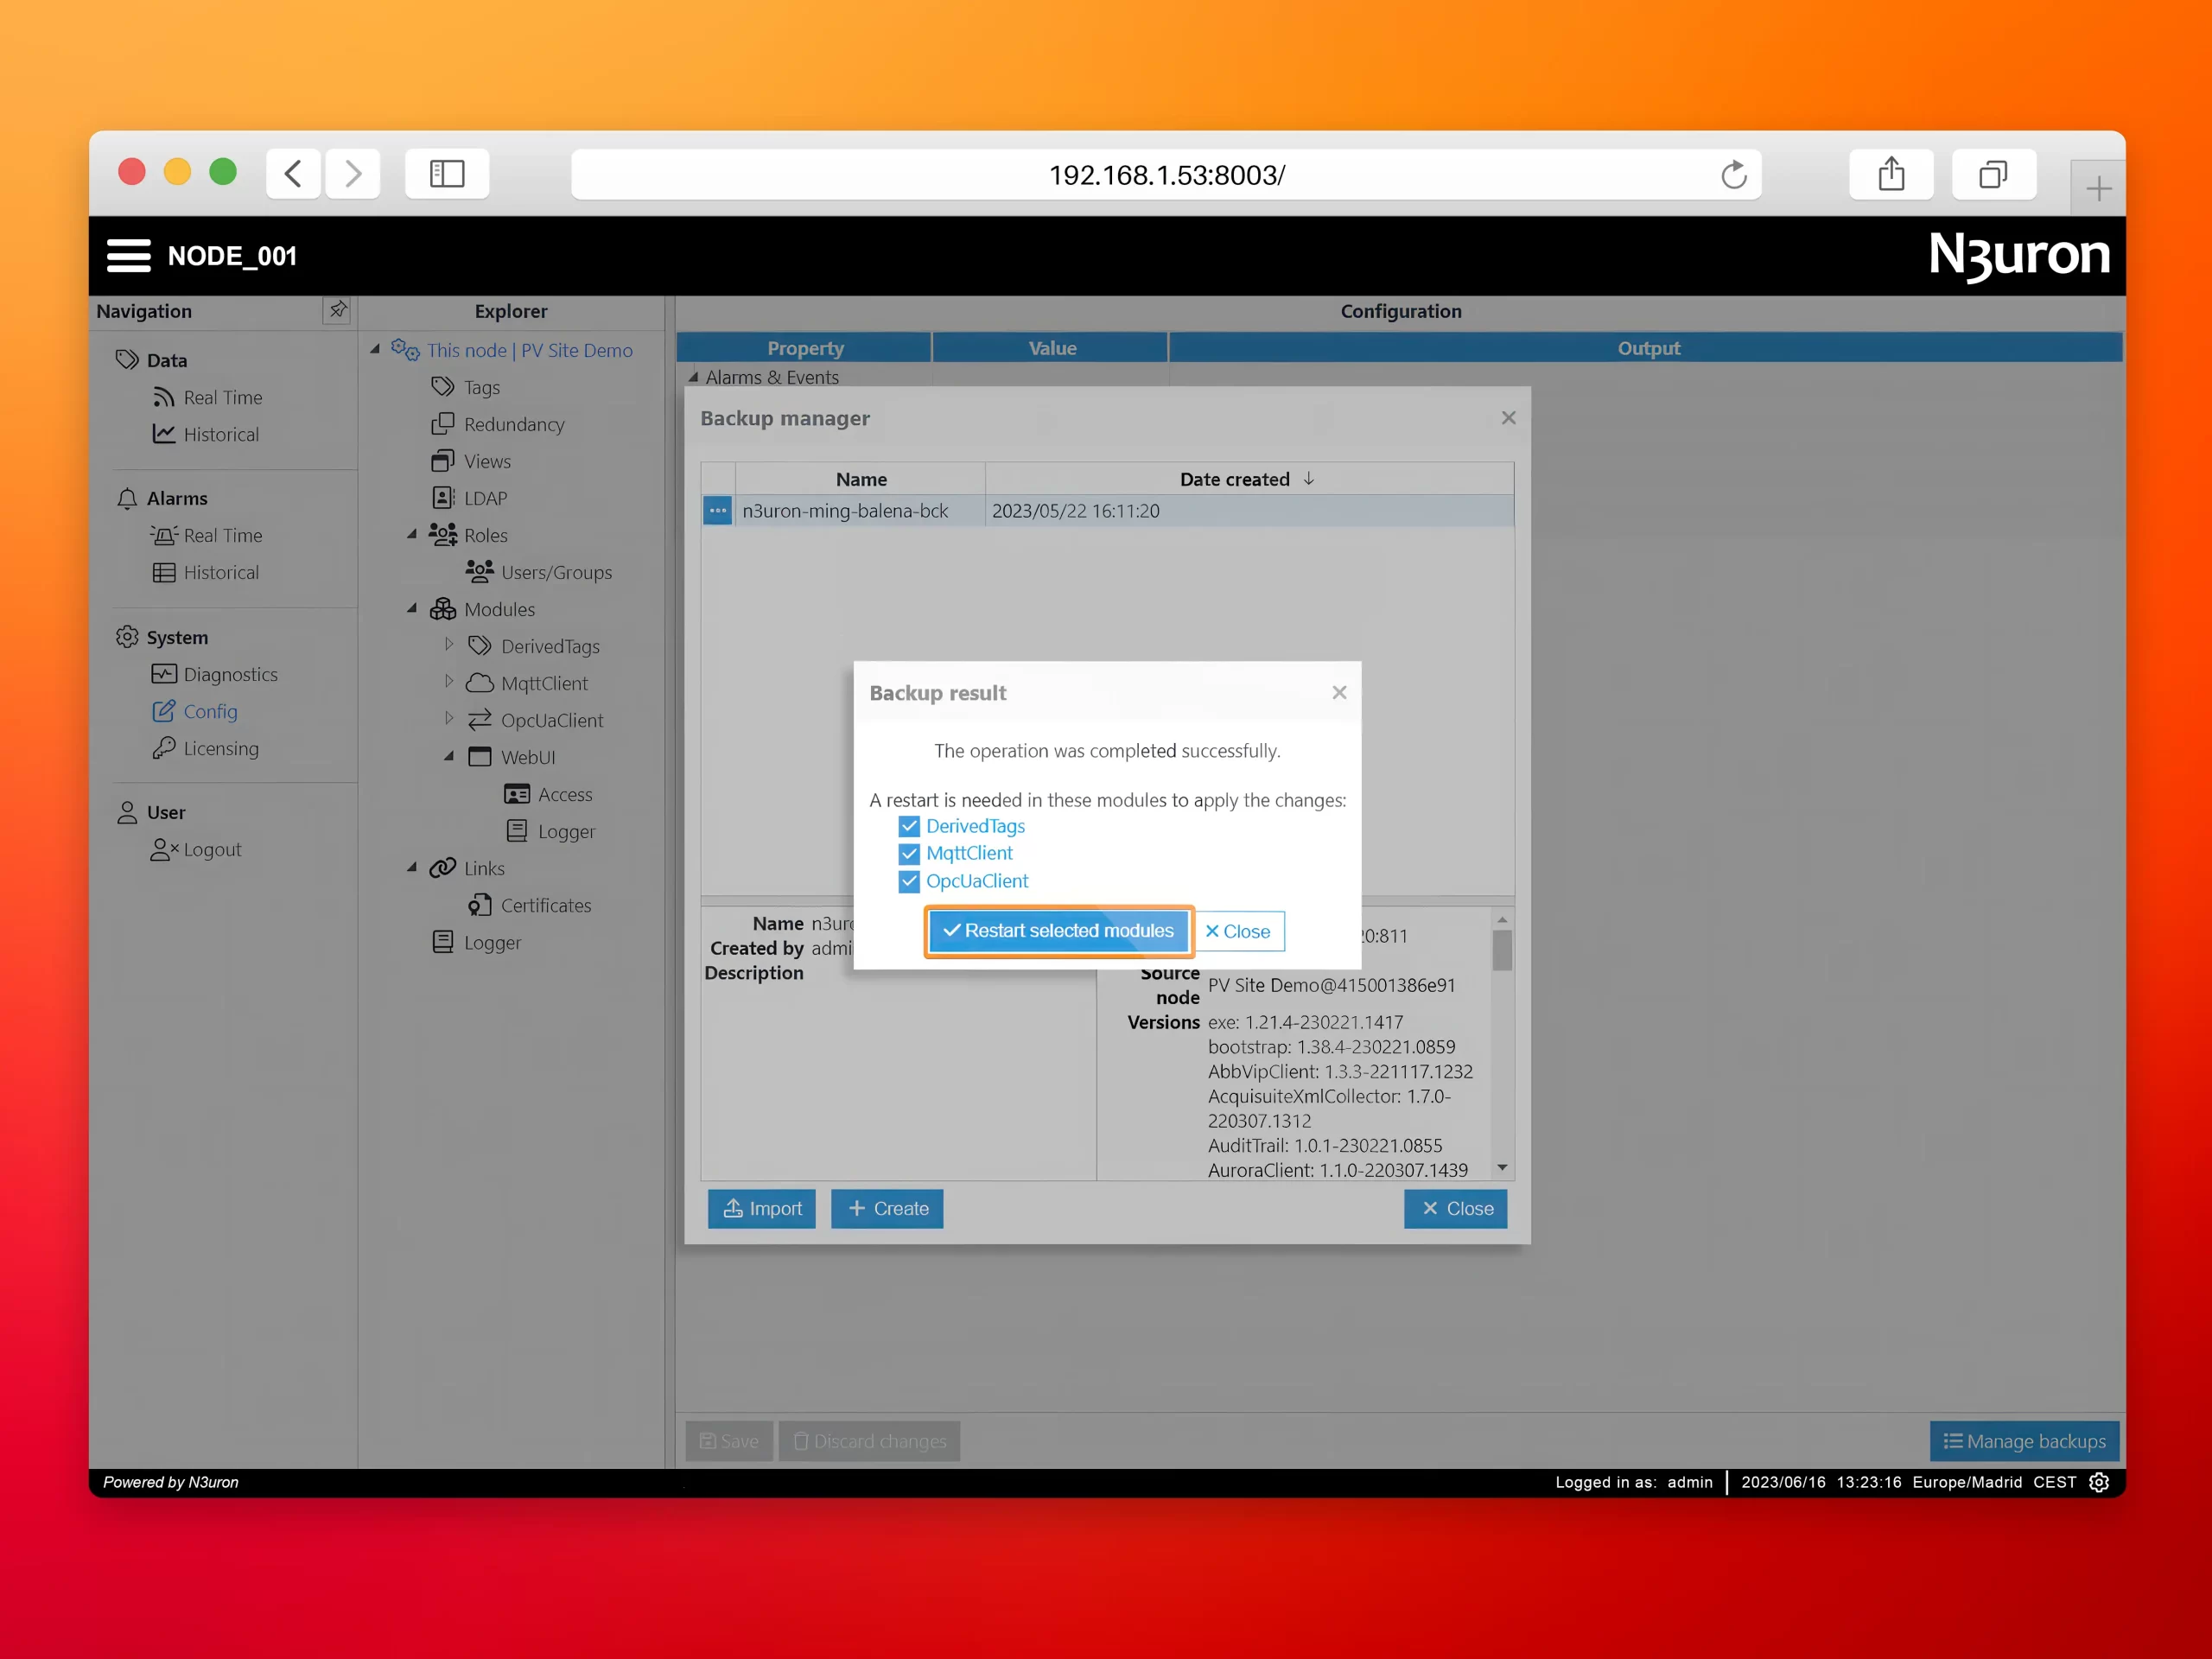
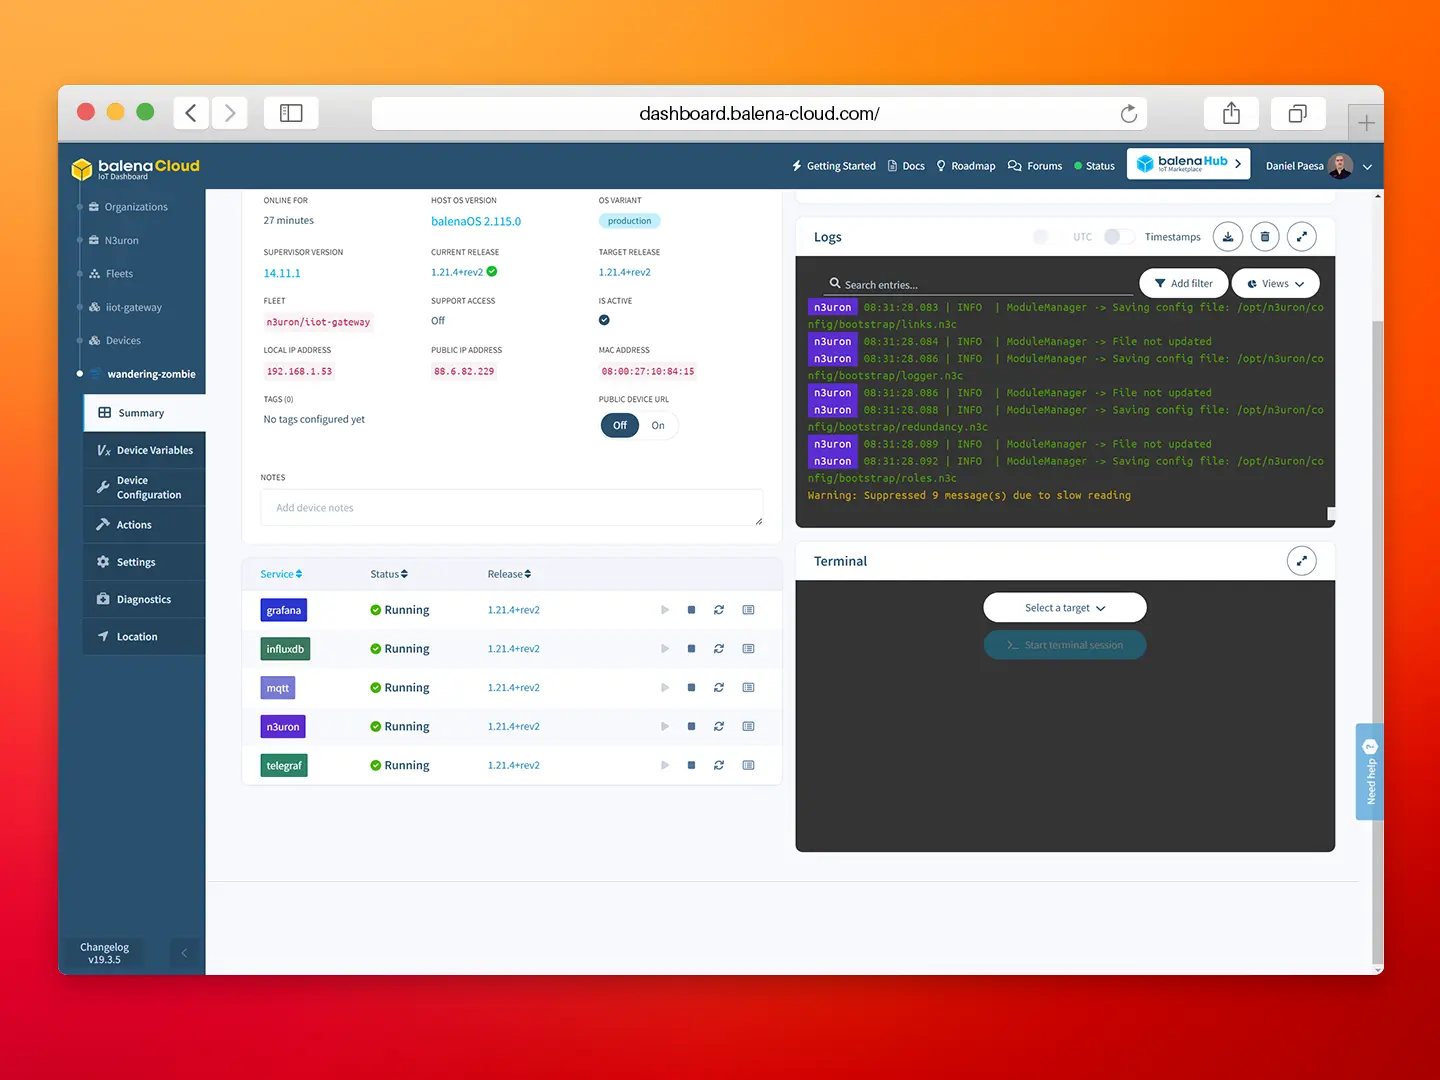
- Step 4: Next, load the backup. When prompted to restart, select Close and manually restart the service from the balenaCloud dashboard.
This image displays the process of loading a N3uron backup file from the Backup Manager panel in the WebUI interface.
The image highlights the step of restarting the N3uron service within the WebUI interface Using the Backup Result pop-up.
Screenshot showing the restarted balenaCloud Dashboard page.
After restoring the node backup you will get a fully configured N3uron instance. Take some time to review the node and its configuration.
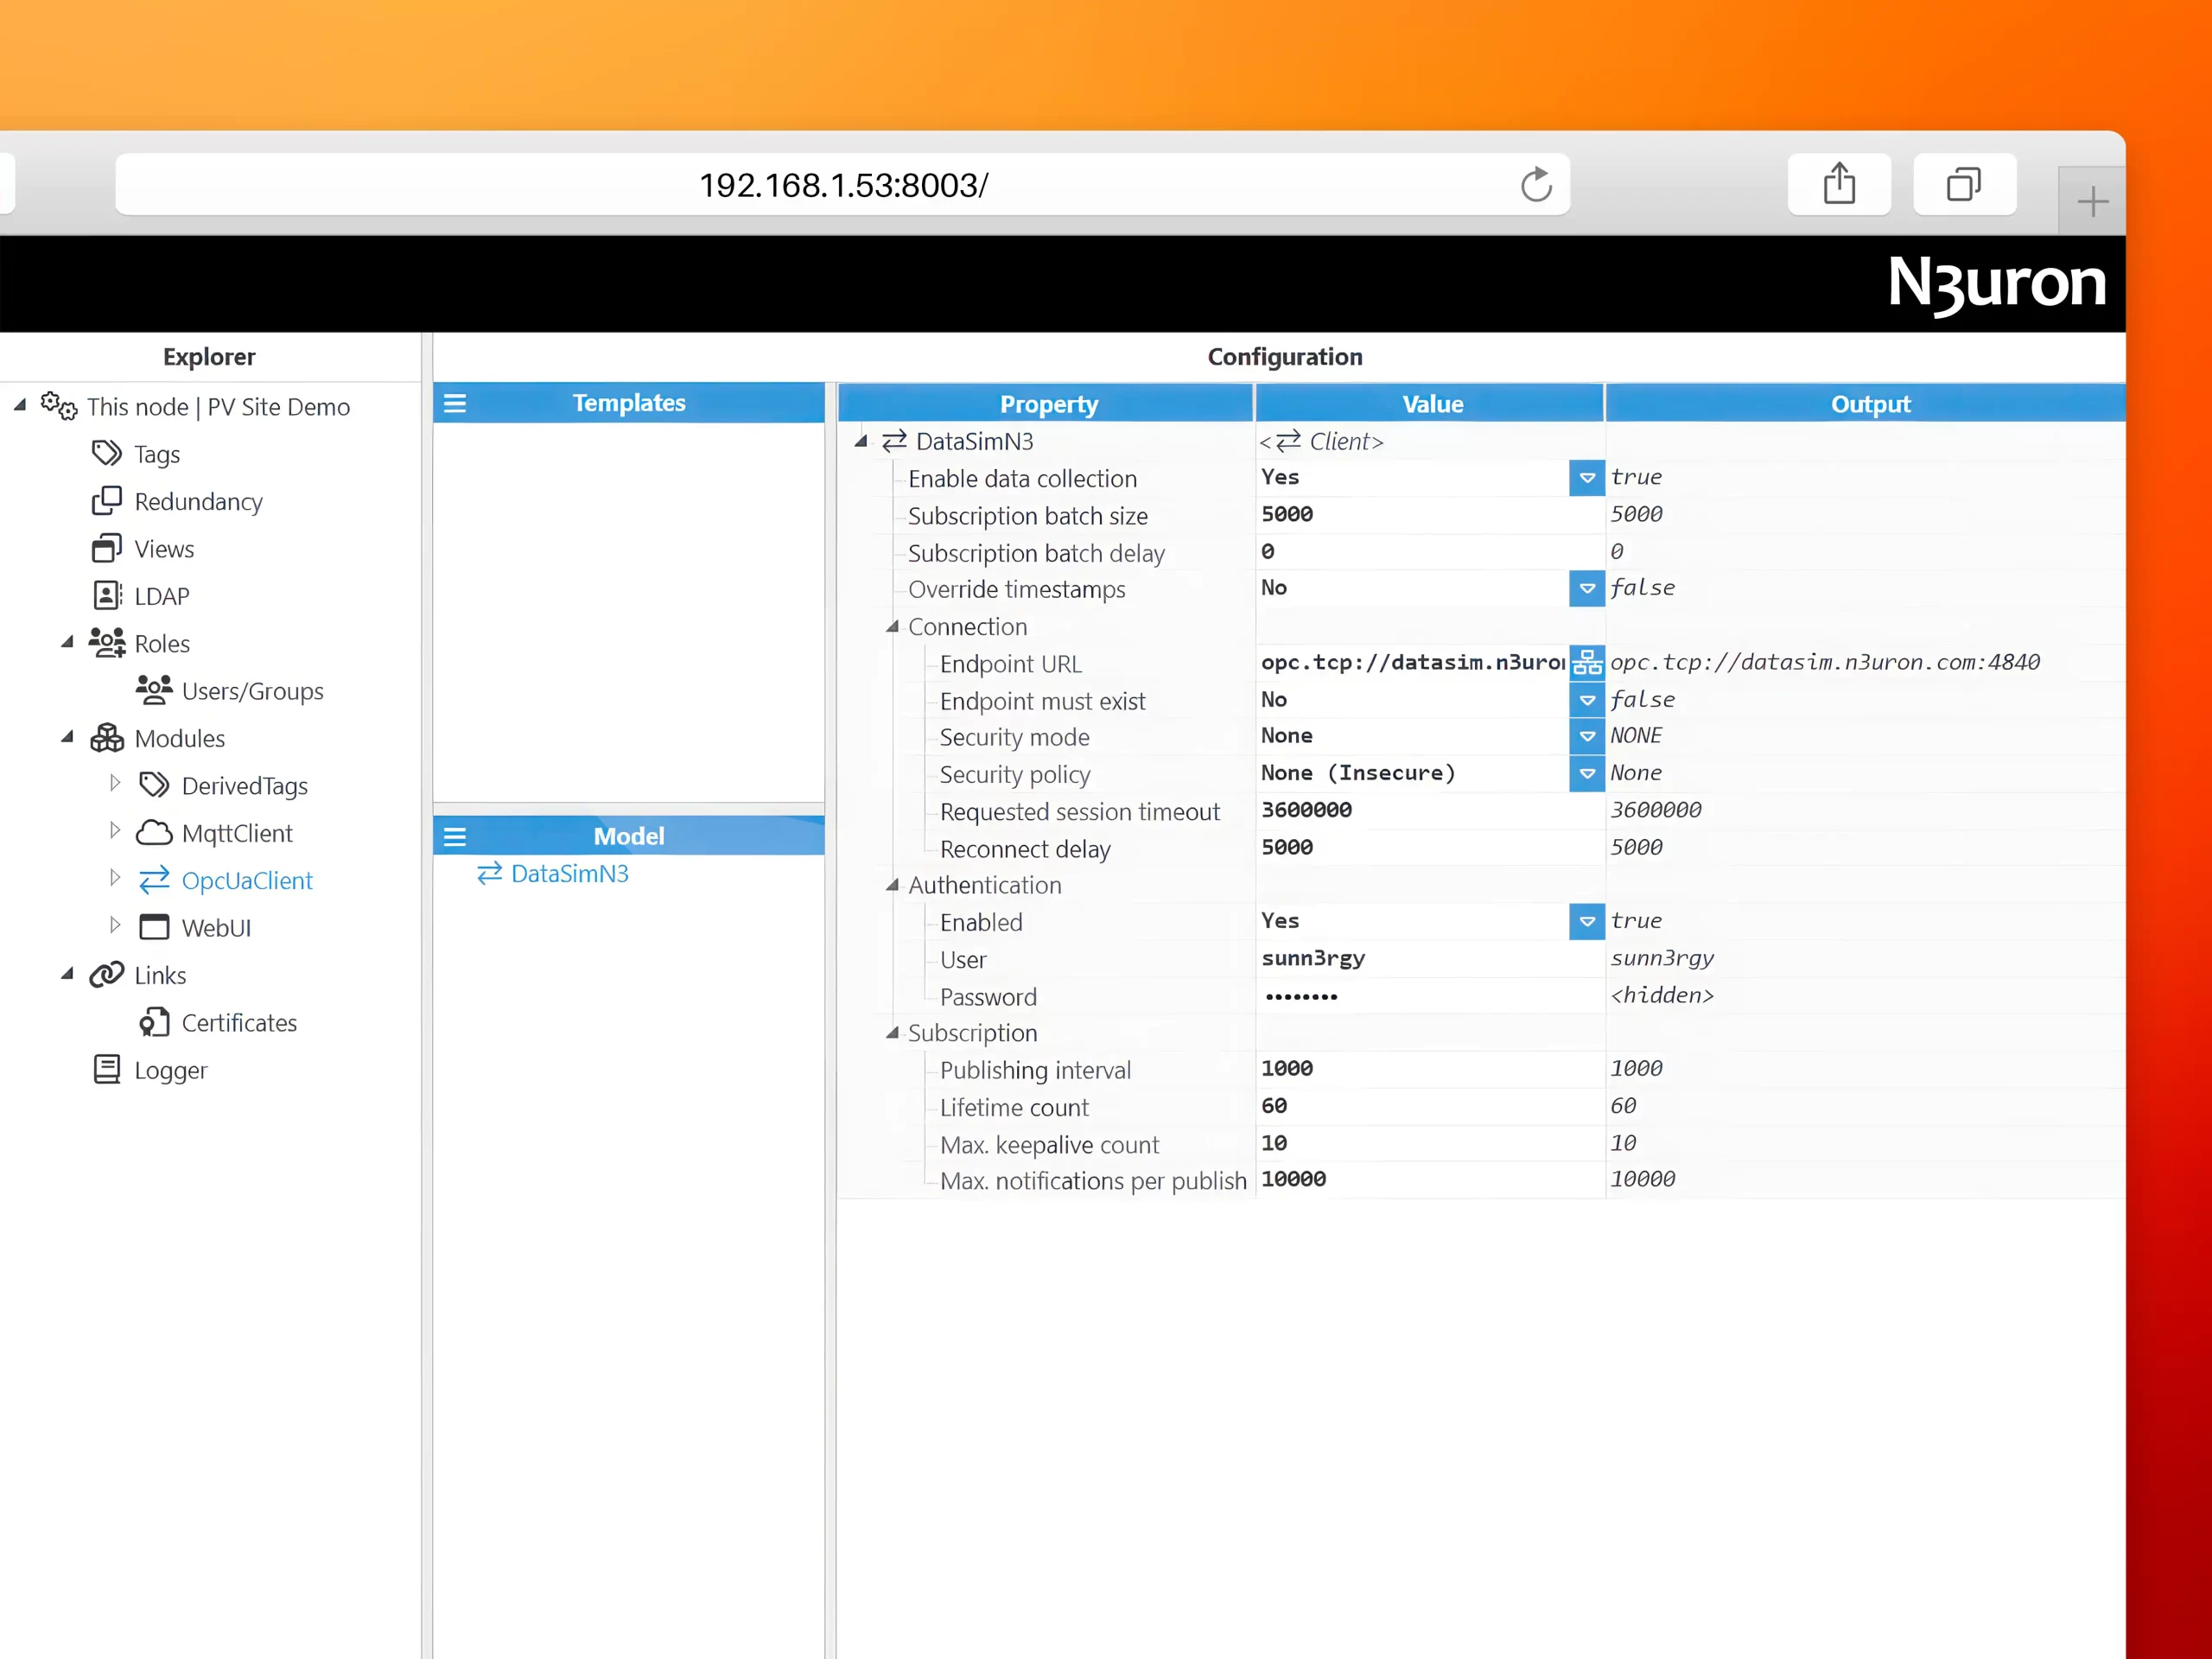
For example, you may see an OPC UA Client connected to datasim.n3uron.com:4840, which is receiving real-time data from a PV Plant located in Europe.
The image showcases the configuration panel of the OPC UA Client within the N3uron Web UI interface.
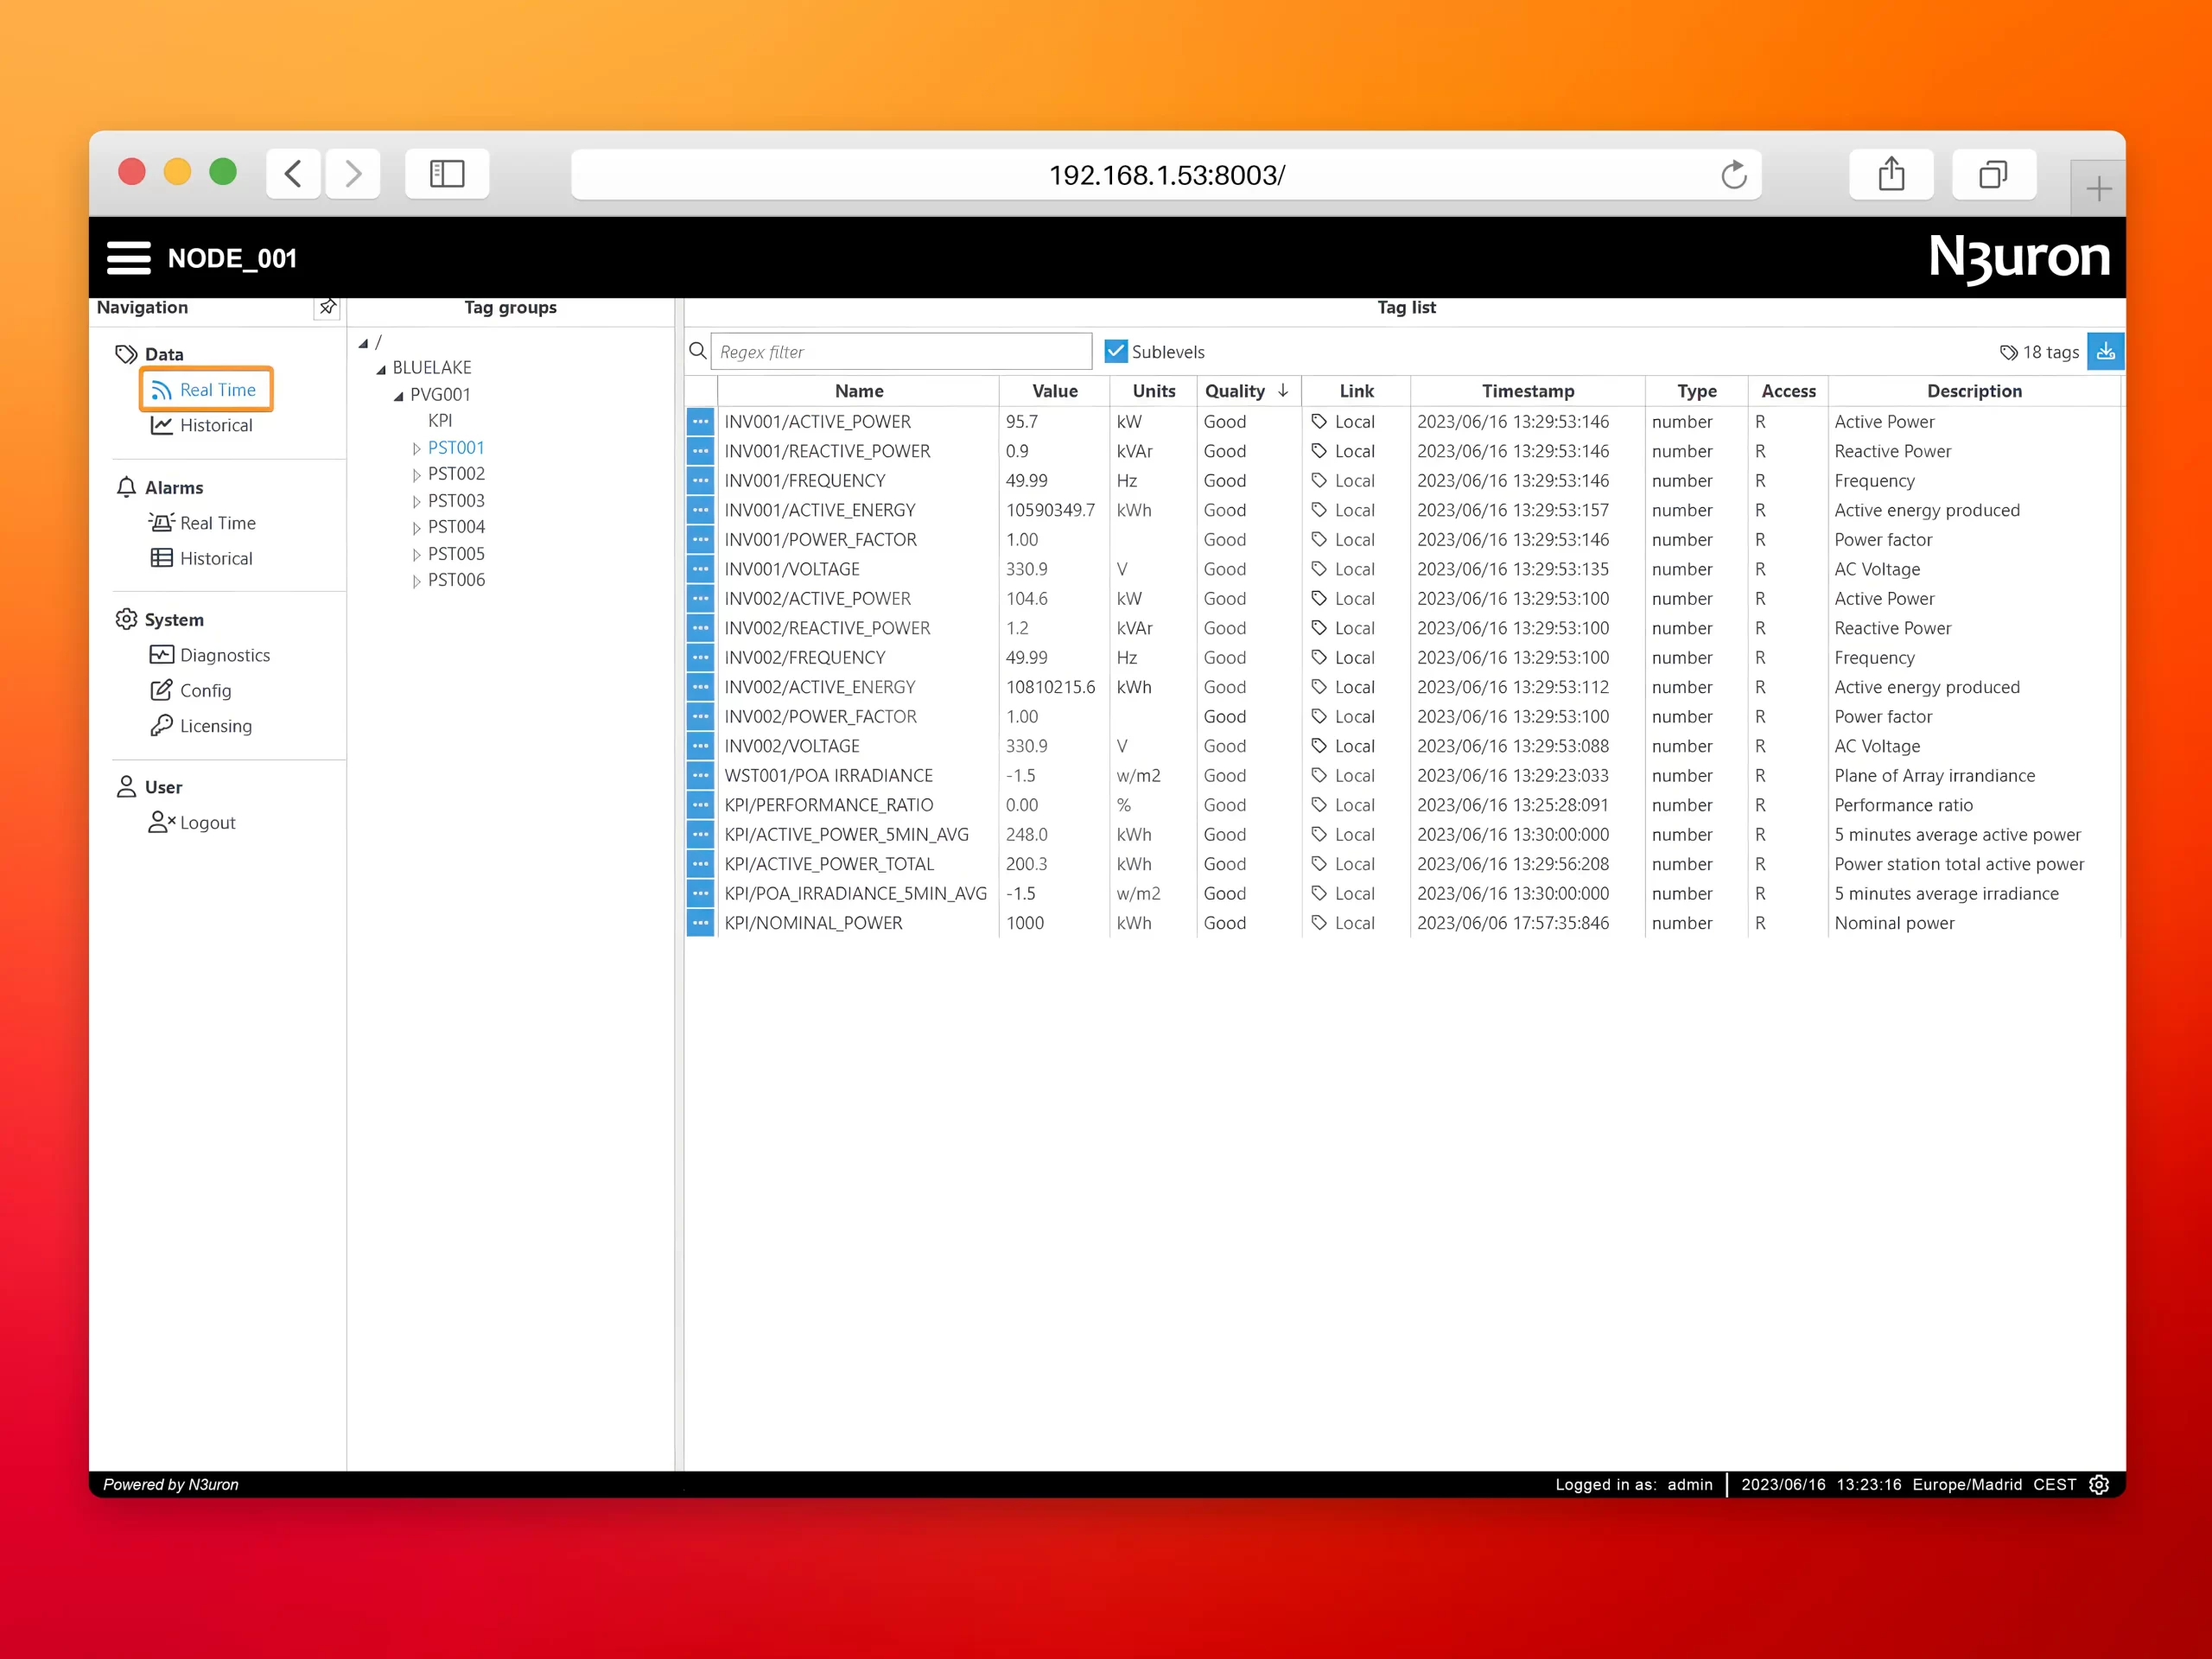
To visualize all the tags and their real time values, go to the Data→Real Time. In the example shown below, the Power Station 1 (PST001) is selected and the Sublevels checkbox is enabled.
The image showcases the N3uron real-time panel view within the N3uron Web UI interface.
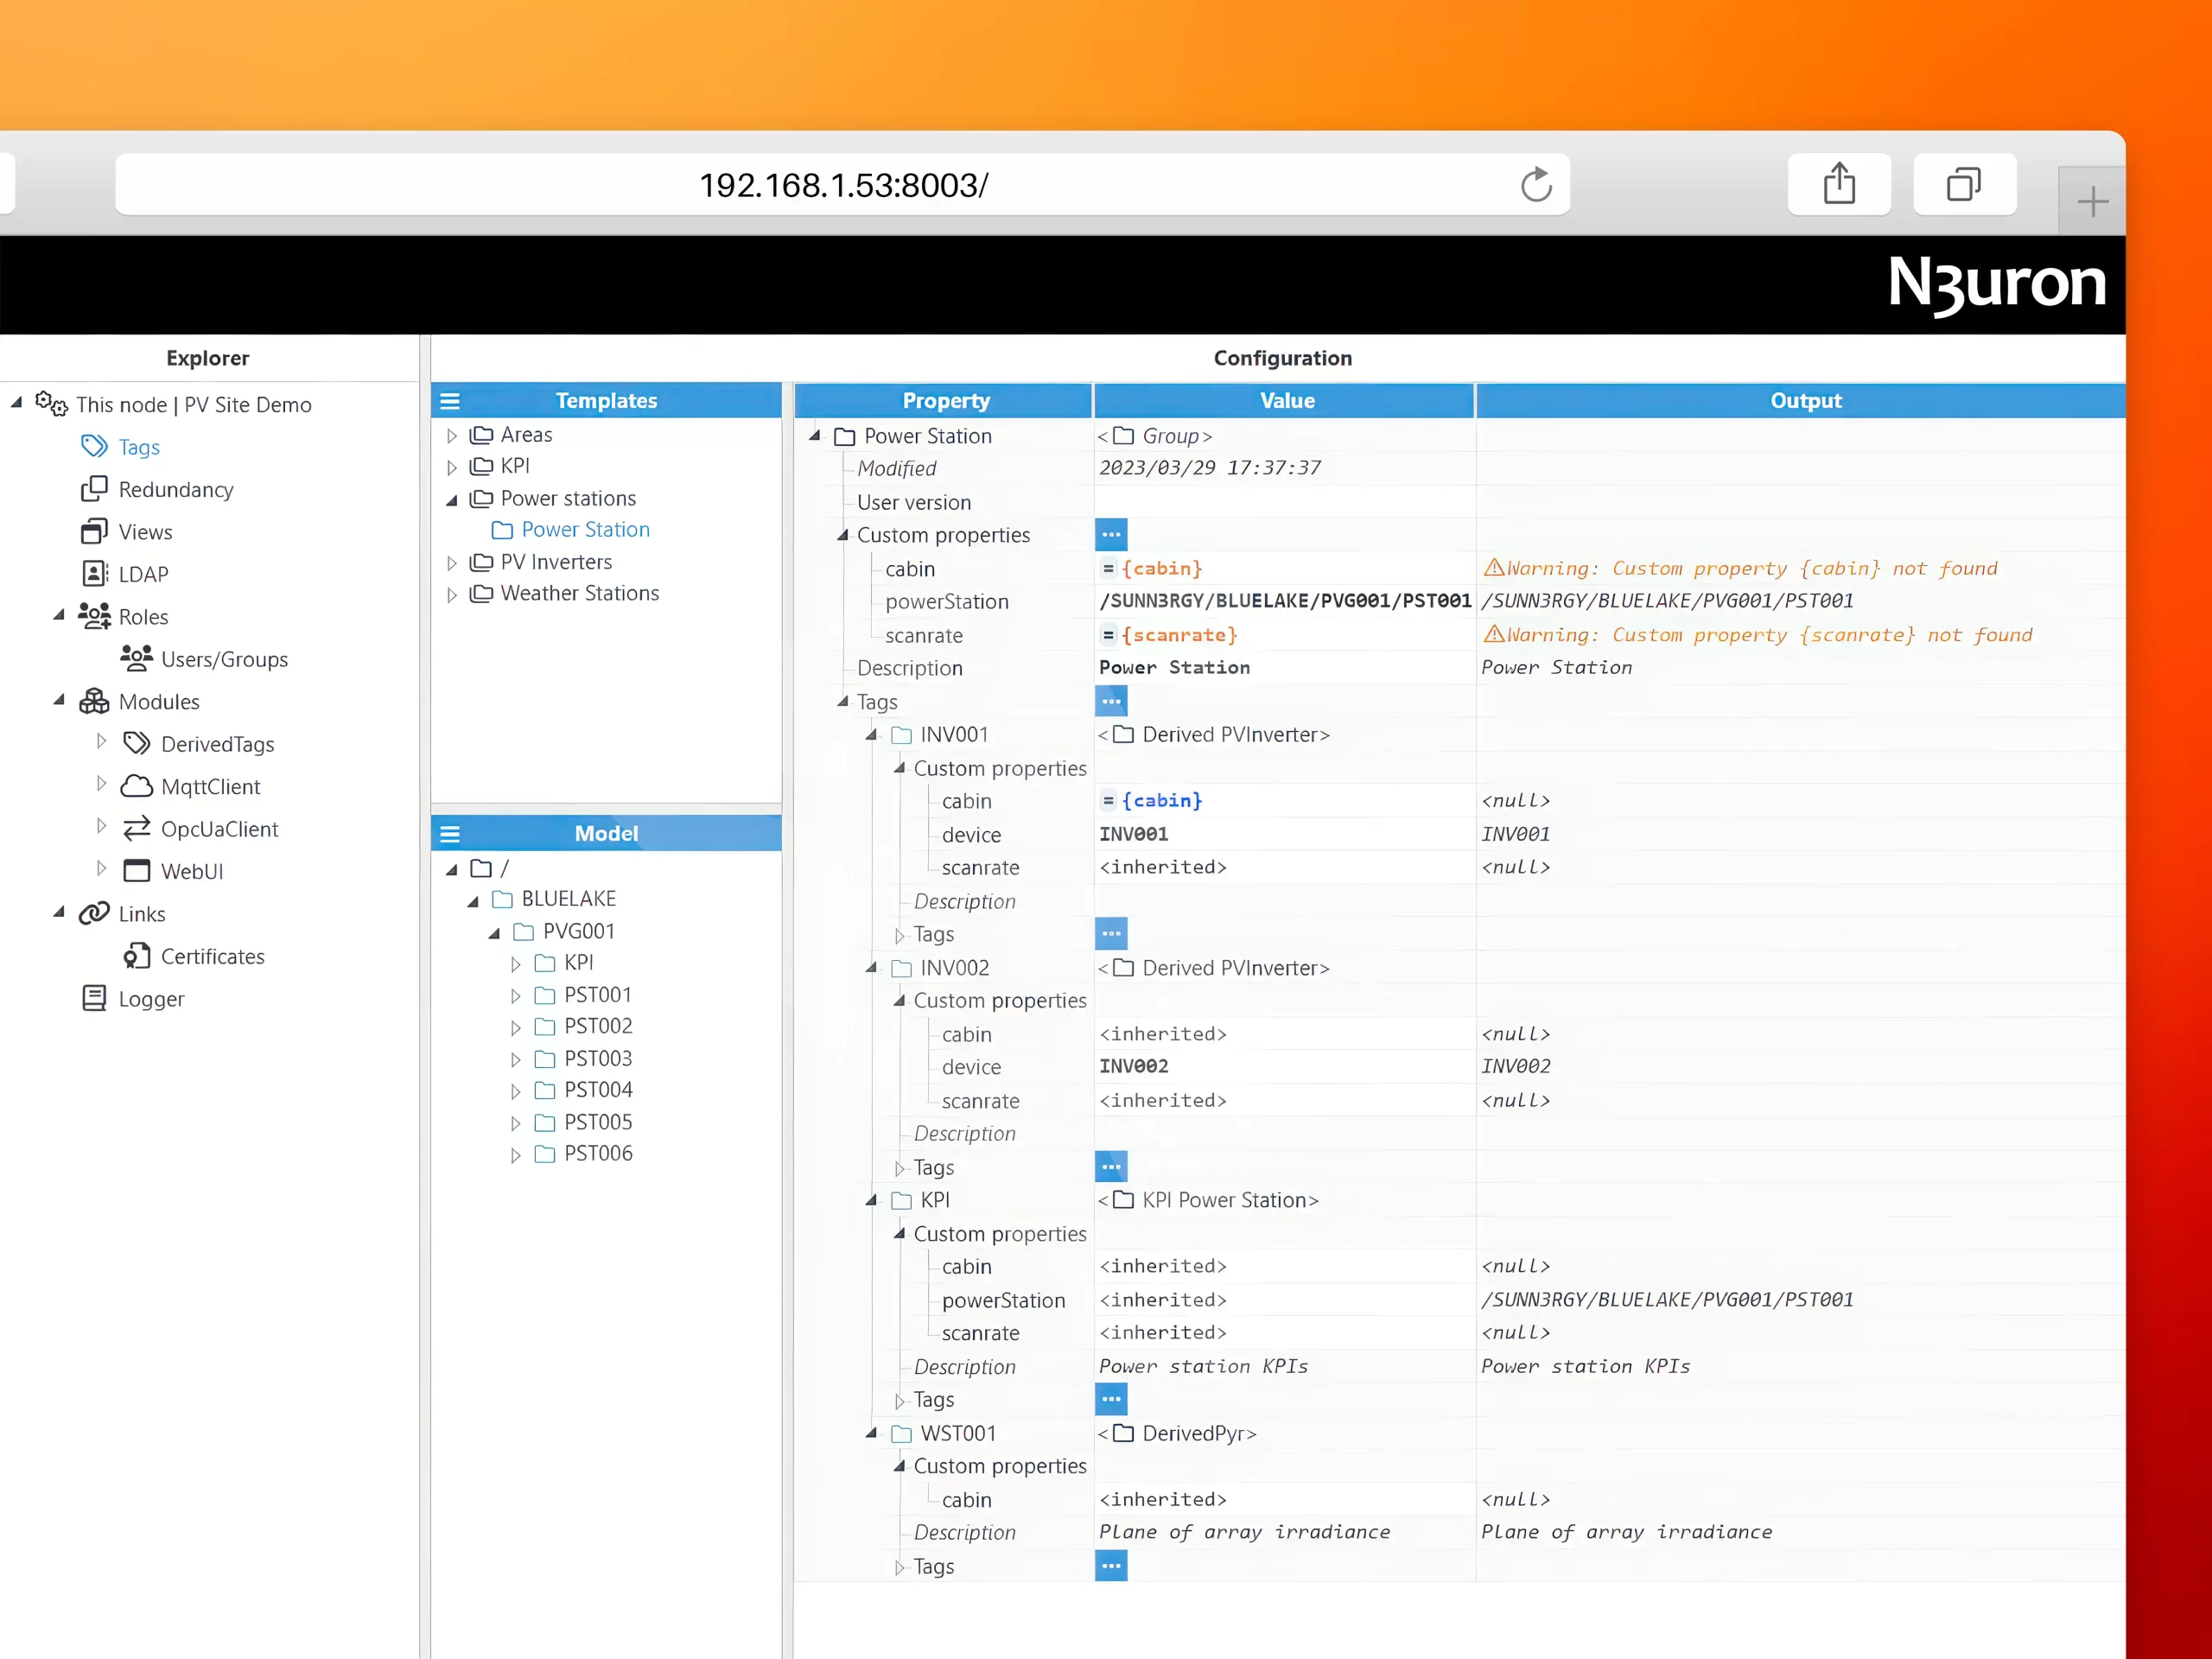
The data model used in this demo represents a Photovoltaic Plant with inverters and weather stations. By using templates you can quickly generate new instances to rapidly build complex data structures. Any changes made to a template definition will be inherited by all its instances.
The image showcases the Tags panel view in the N3uron Web UI interface, demonstrating the seamless process of generating templates for efficient data management.
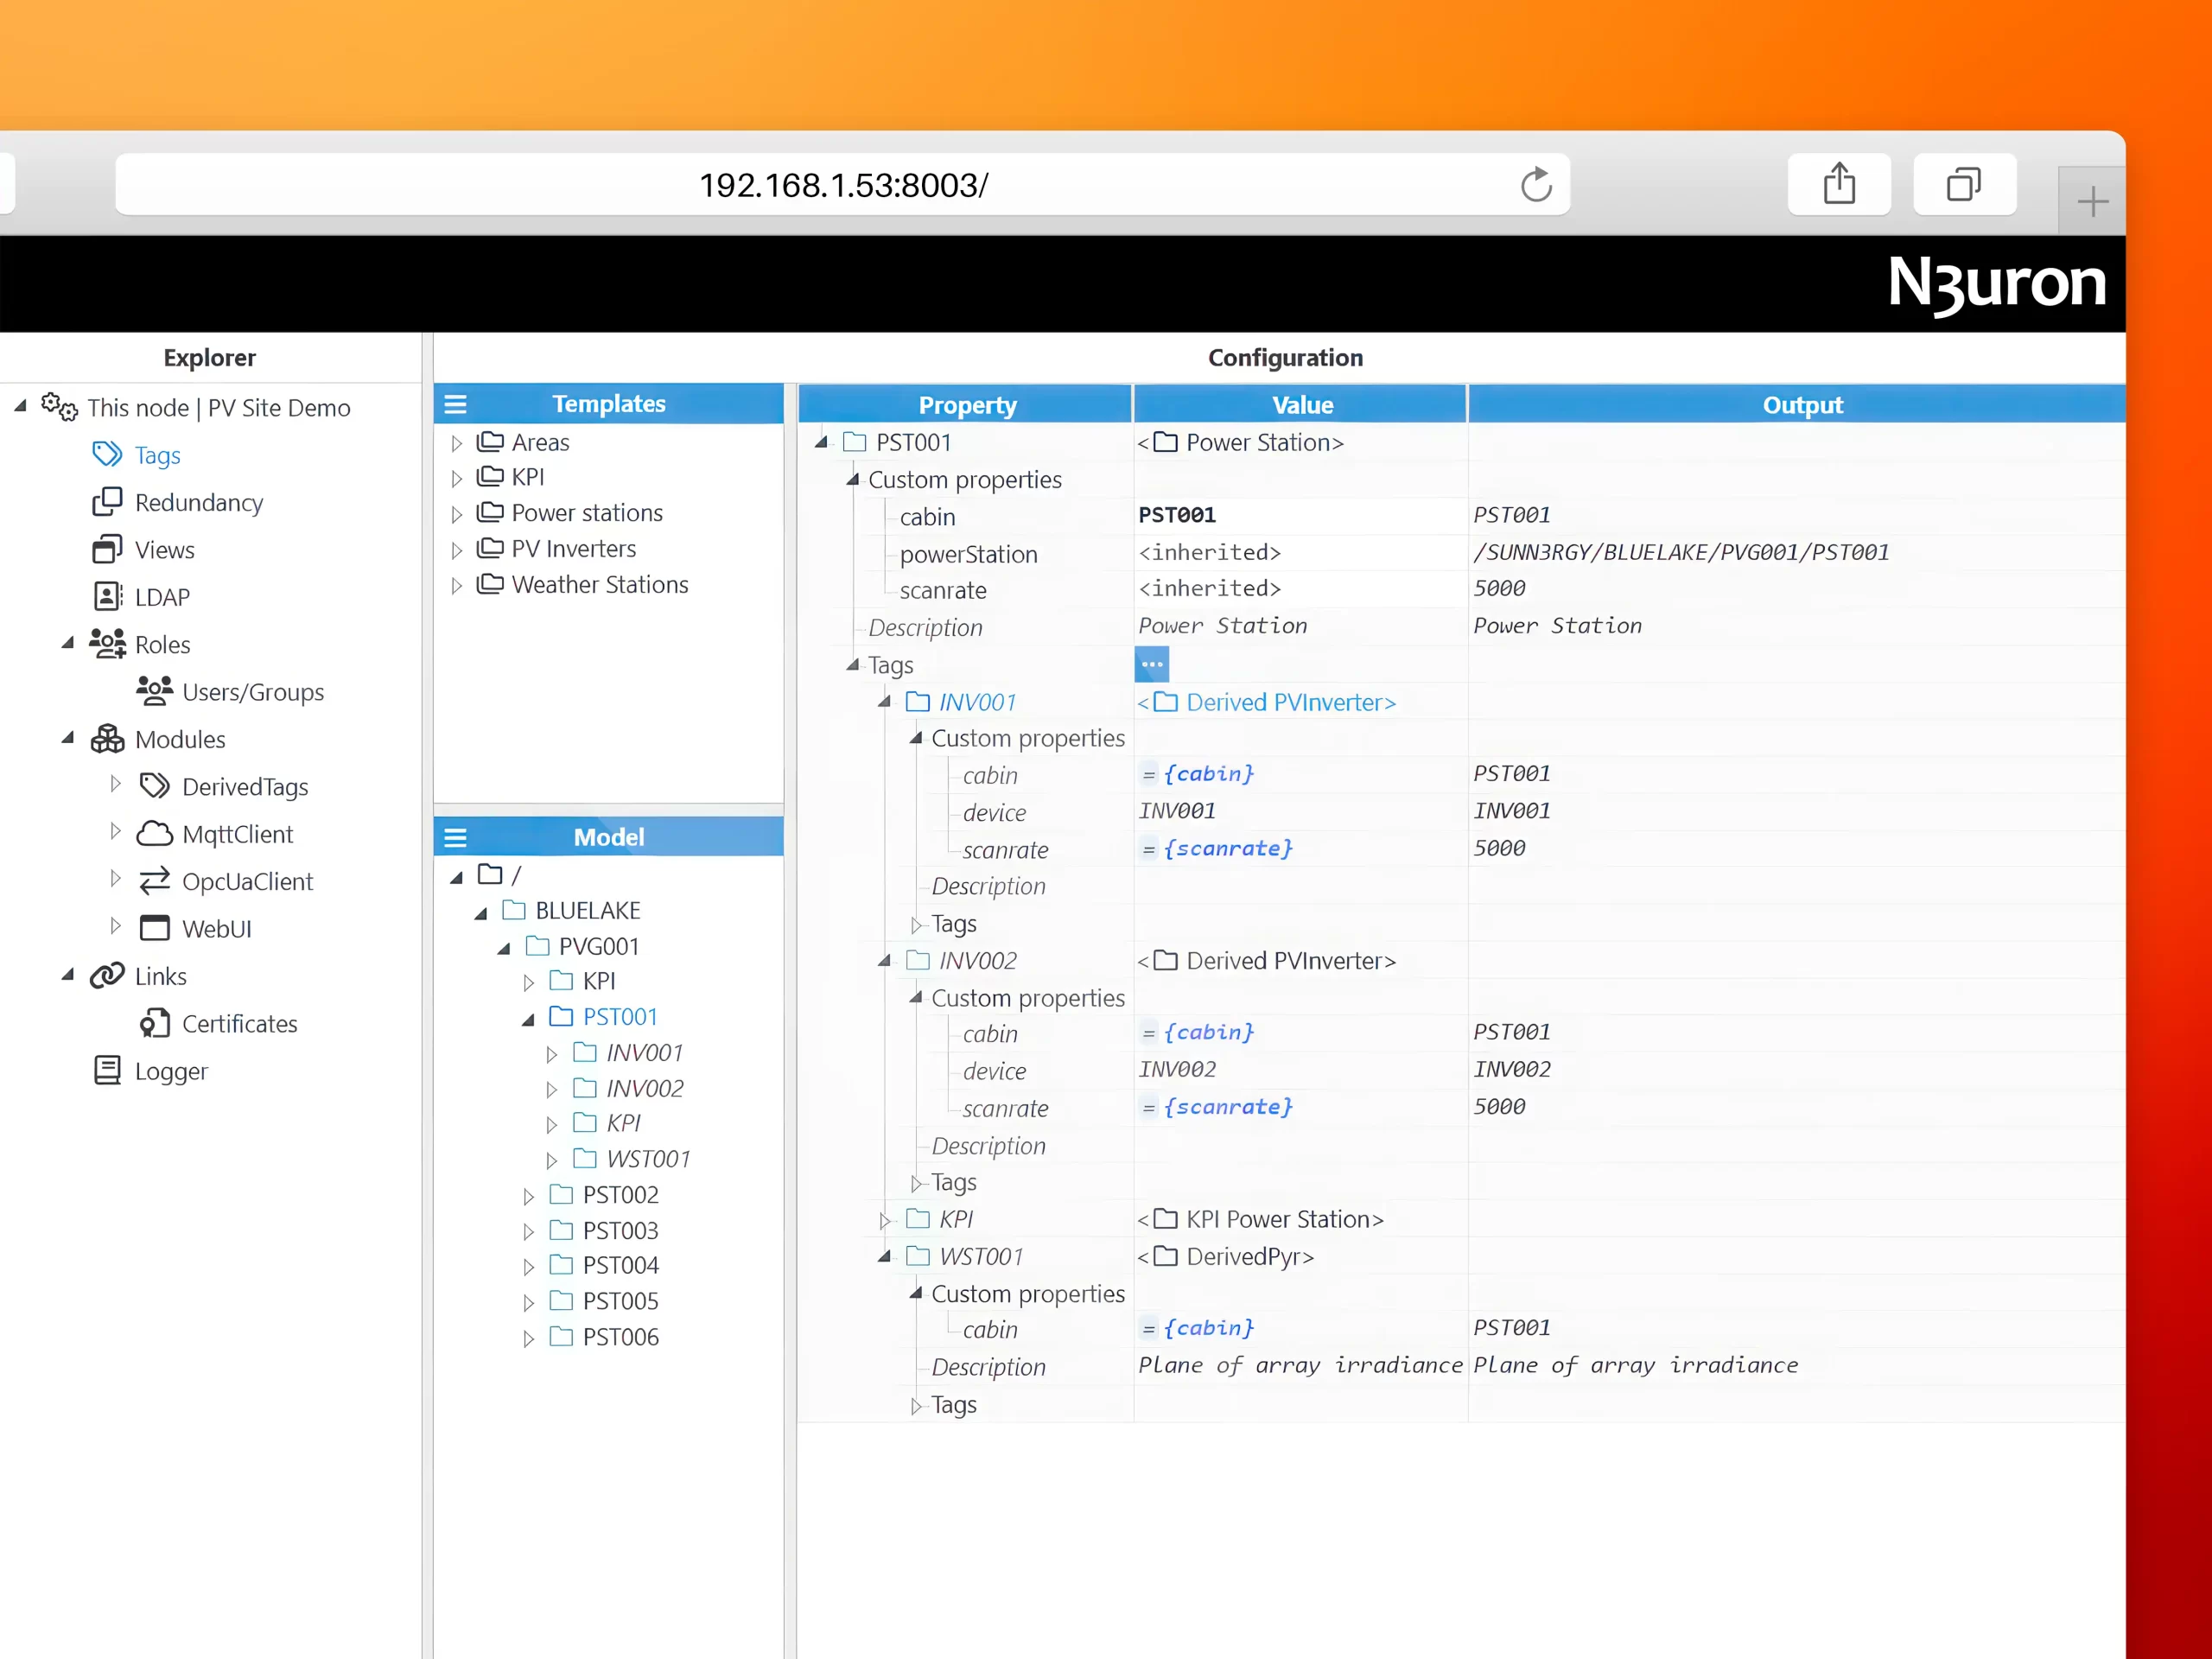
As shown below, the template definition for Power Stations includes two inverters (INV01 and INV02), a Weather Station (WST001), and a KPI folder with some calculated and aggregated data computed using the Derived Tags module. A template usually has several custom properties that act as variables and can be referenced by the items within the template.
The image illustrates the Tags panel view in N3uron, highlighting the template structure for Power Stations.
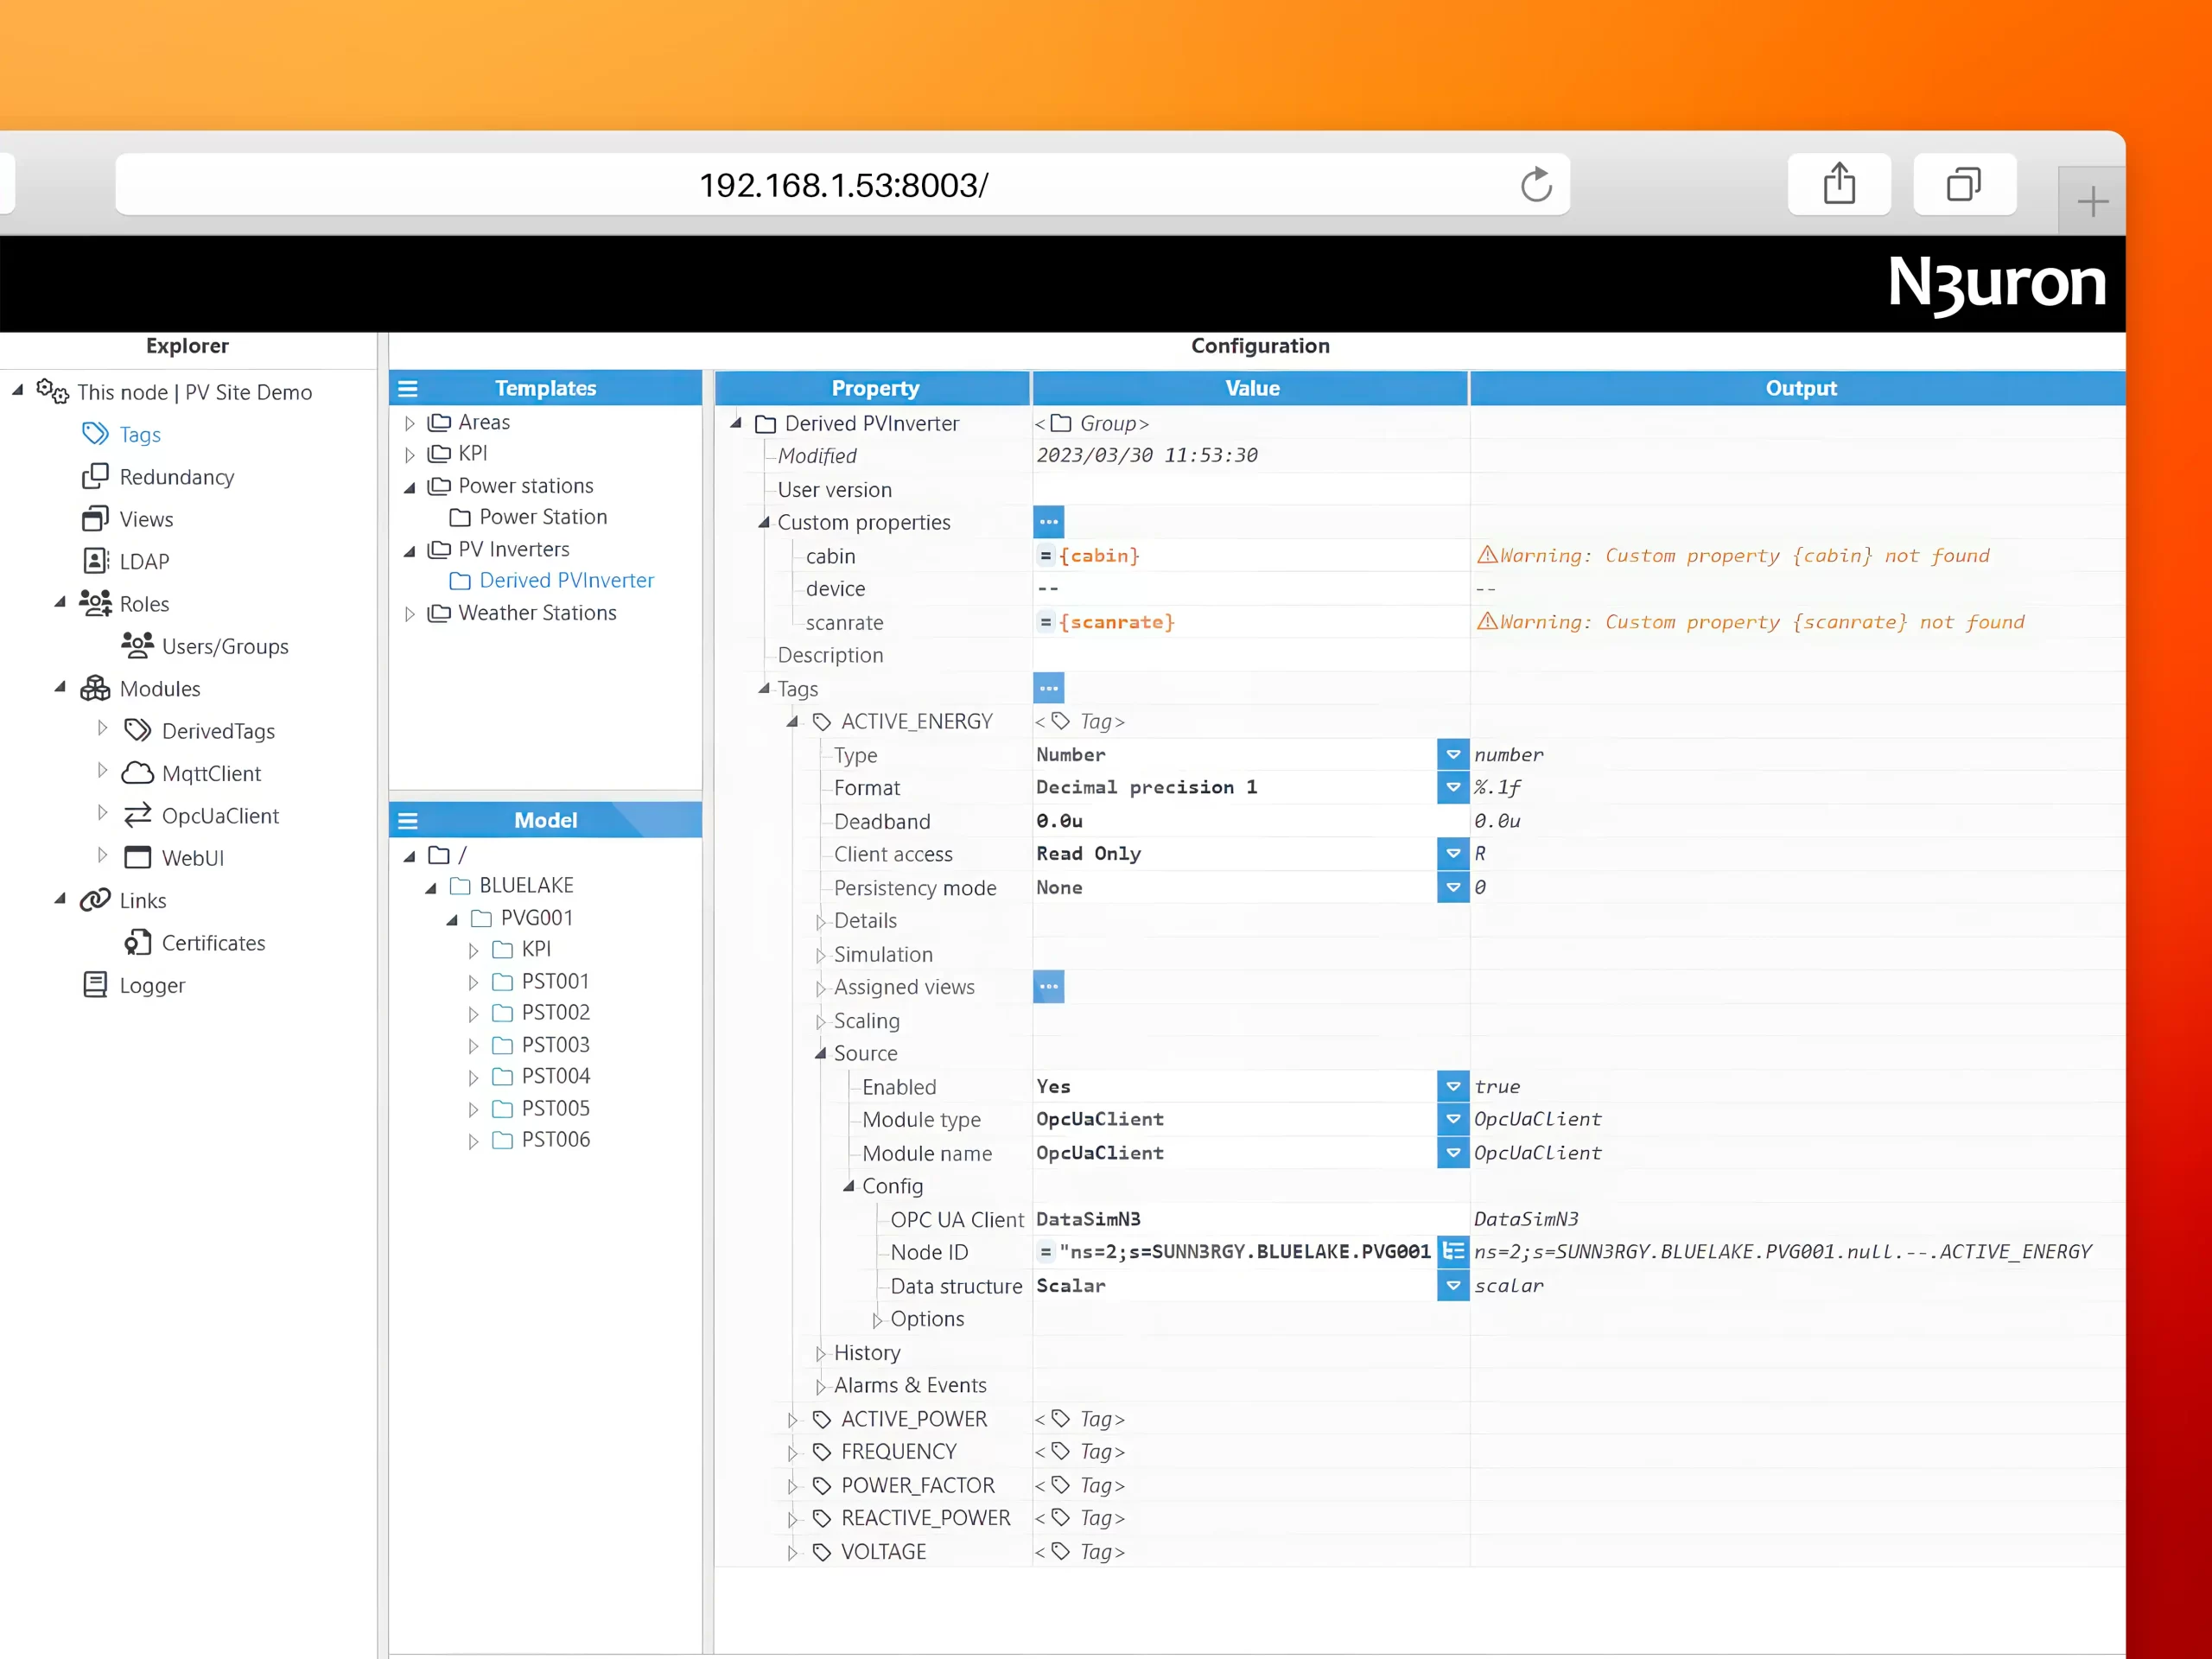
The image below shows how to reference Custom Properties in expressions, when configuring tags.
In the image, you can see the Tags panel view in N3uron. It showcases how to reference Custom Properties in expressions when setting up tags.
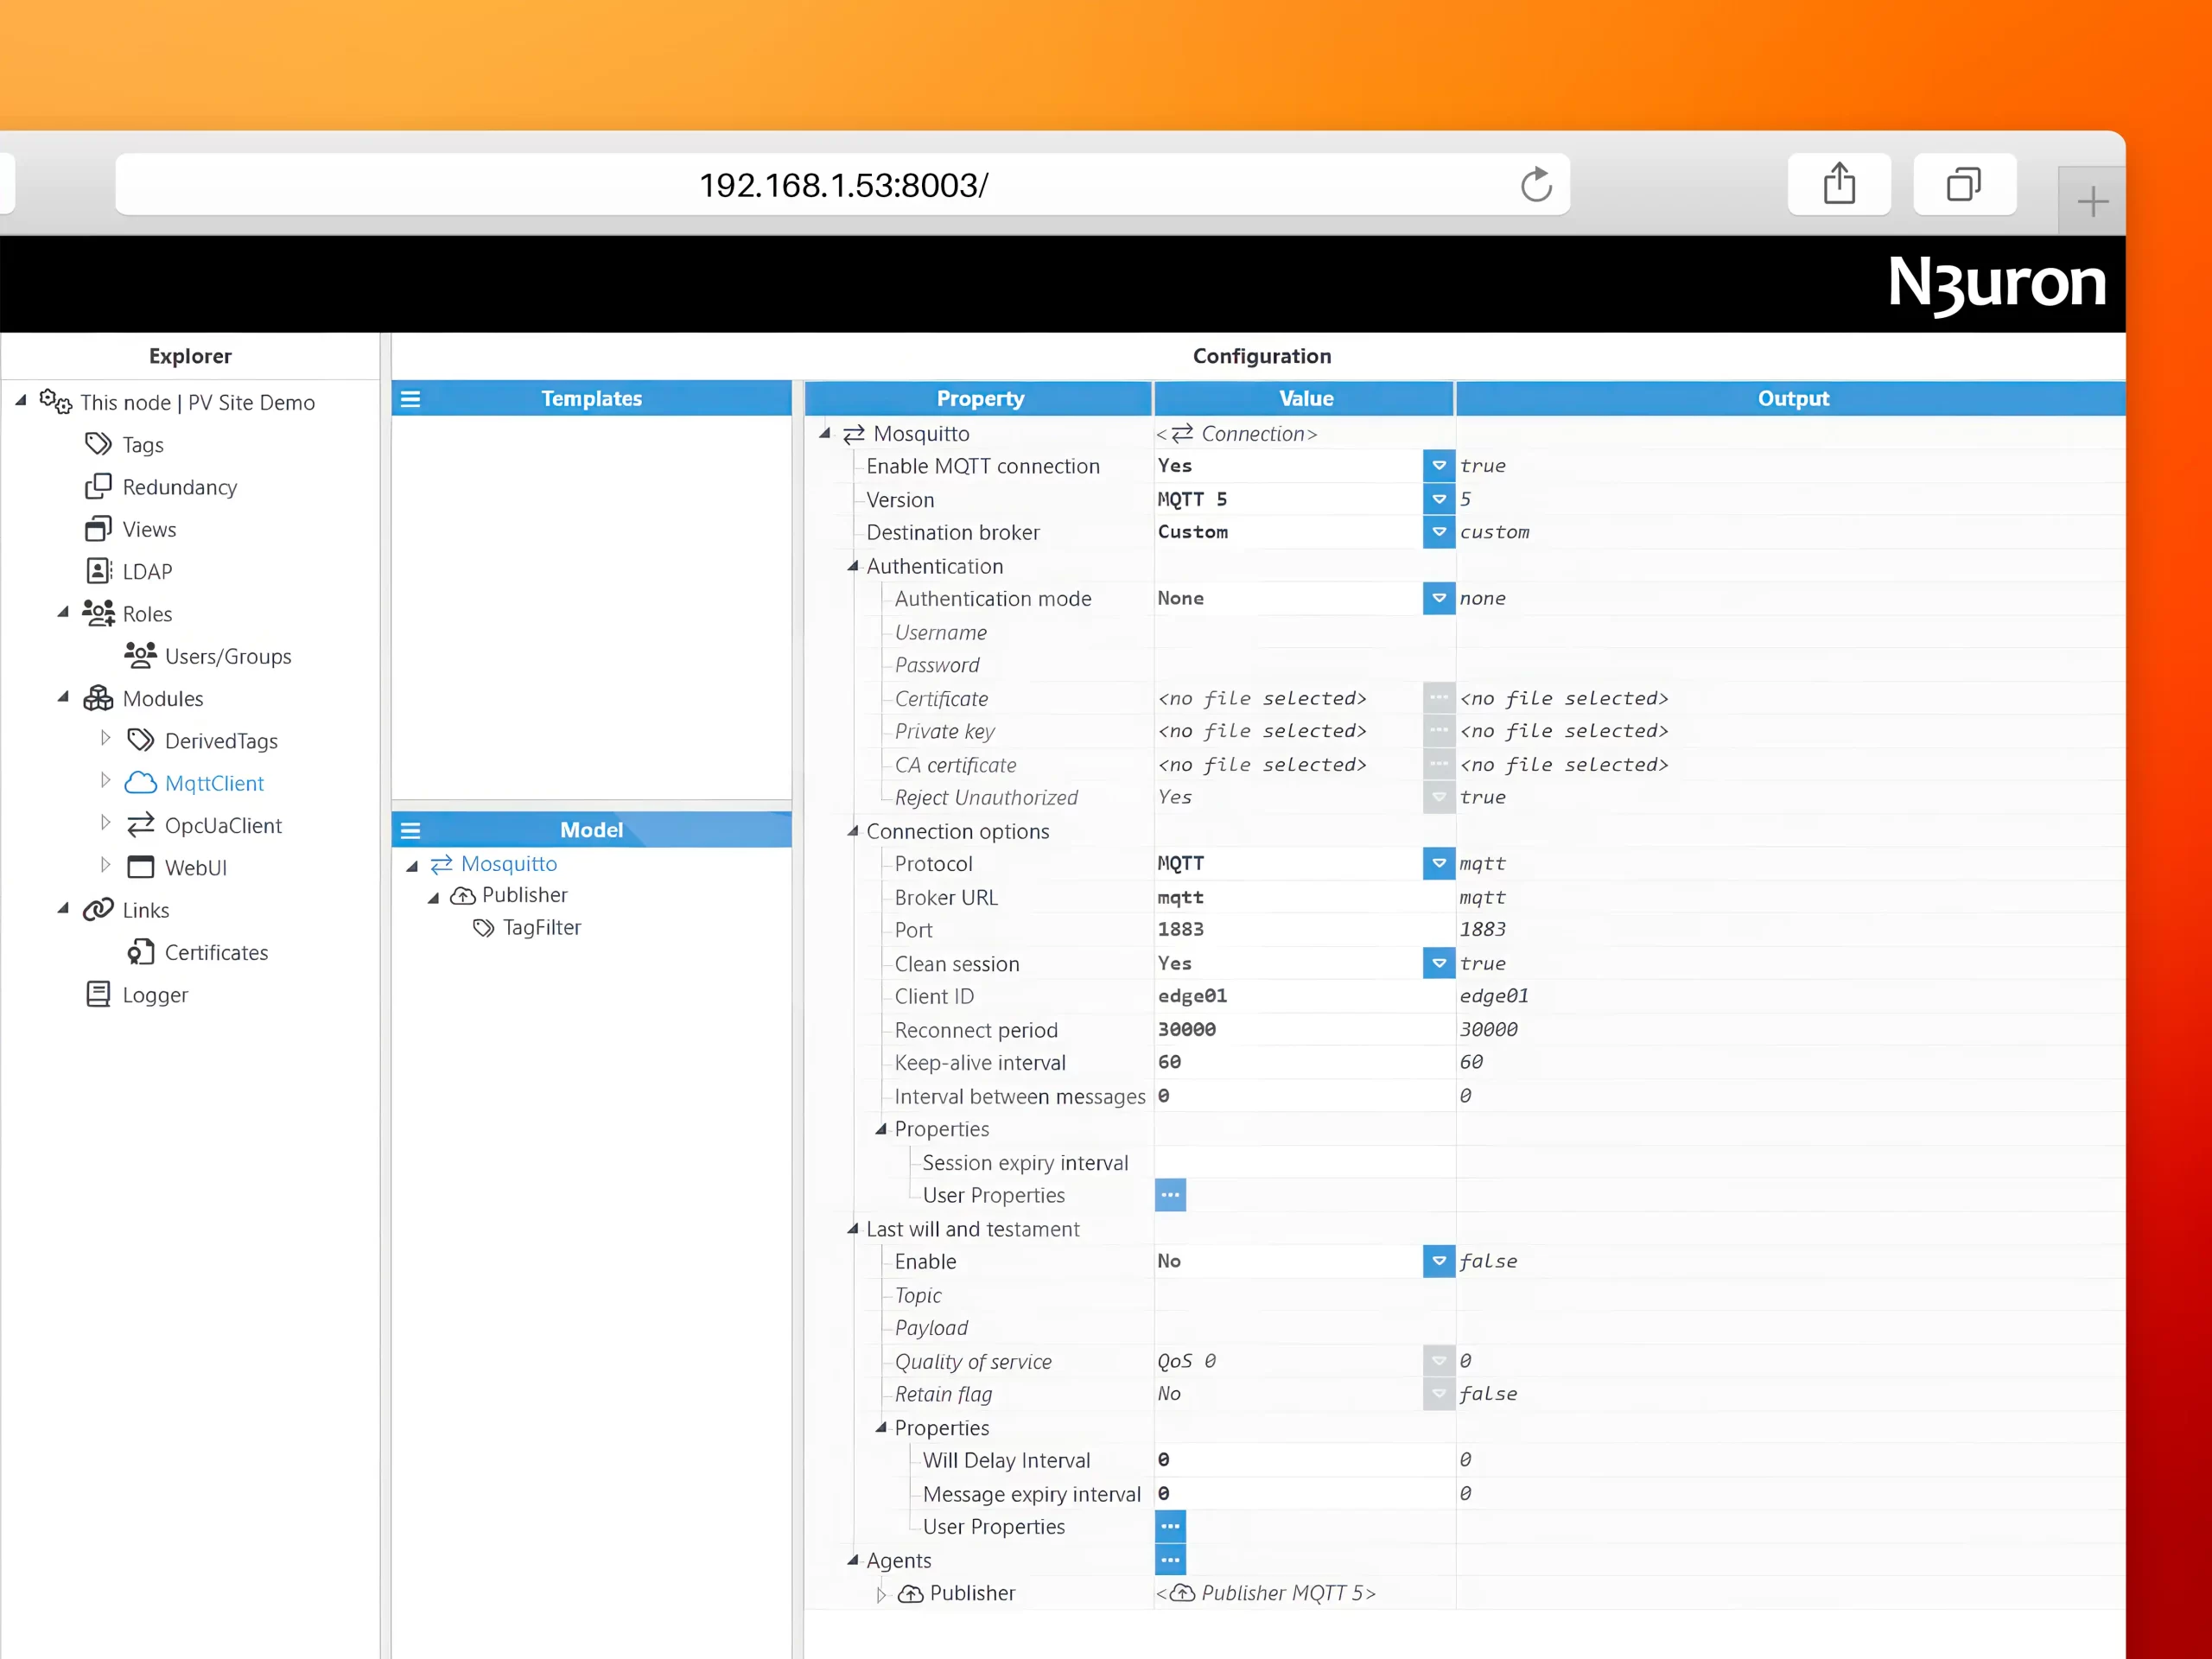
As you continue to explore the N3uron instance, you will also find that the node includes an MQTT Client that is already configured to push data to the local Mosquitto MQTT broker.
This picture displays how to set up the MQTT Client on N3uron, which allows for easy transmission of data to the local Mosquito MQTT broker.
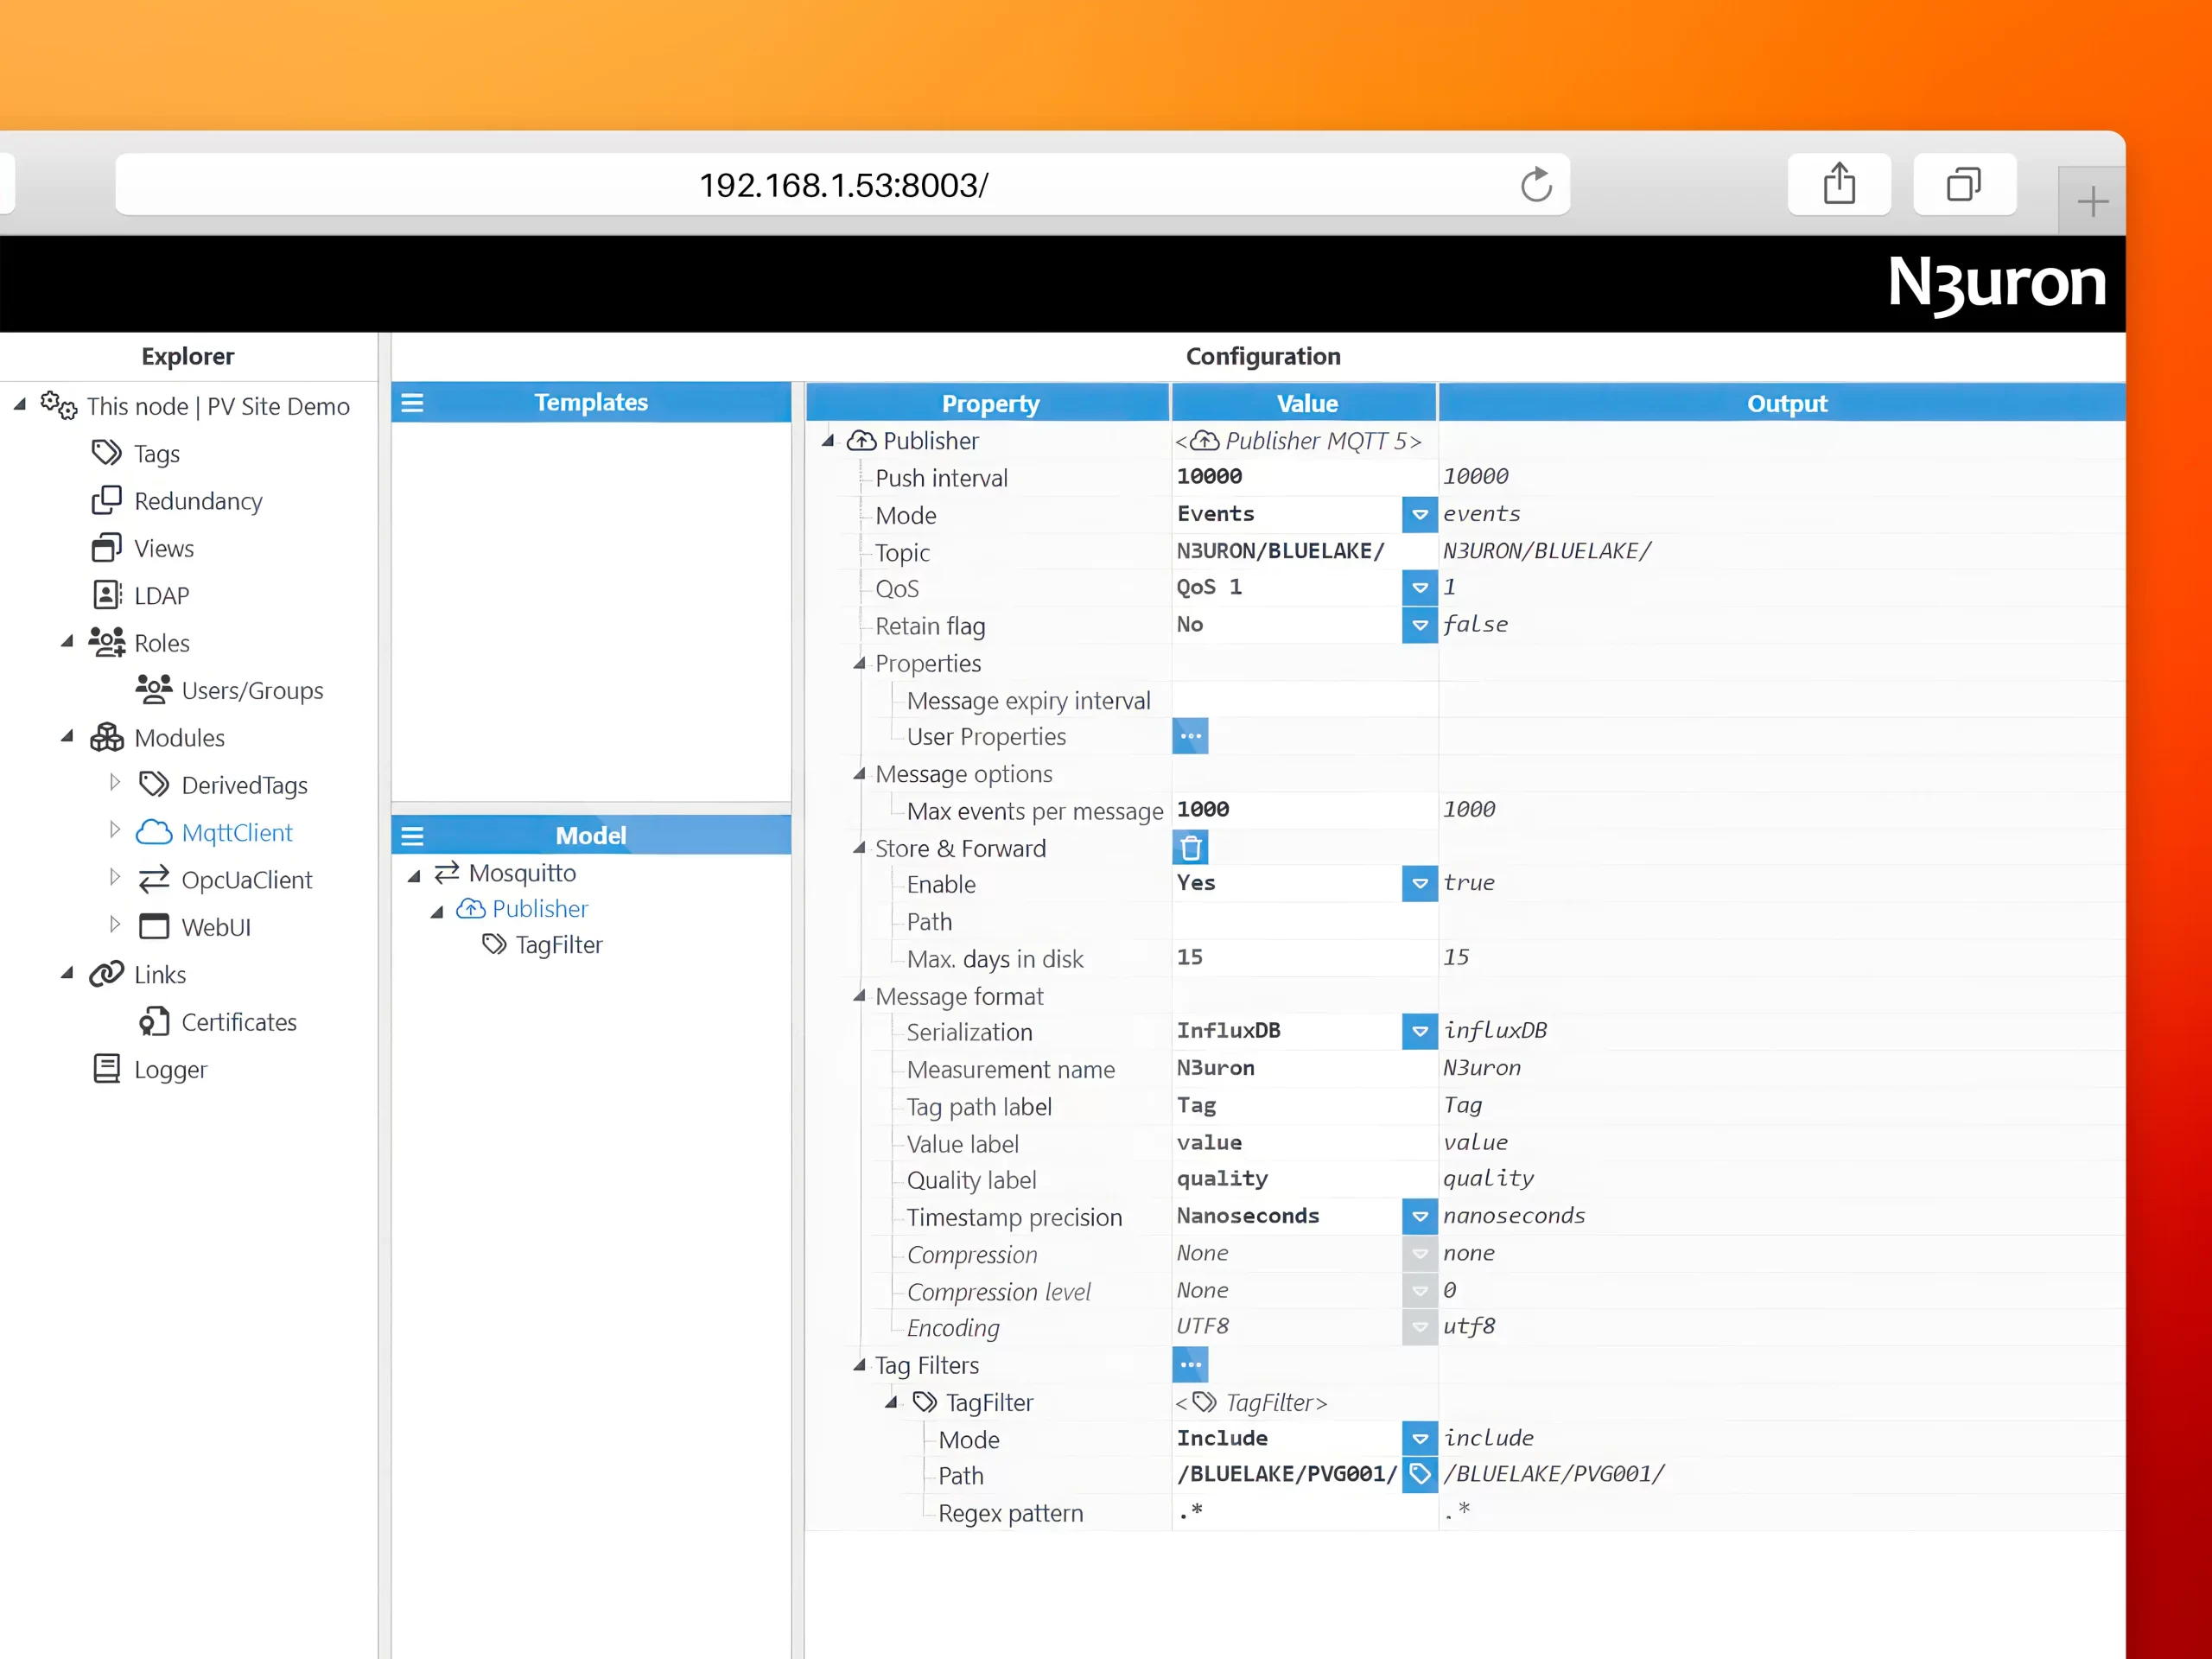
A Publisher has been created to push all tags within the /BLUELAKE/PVG001/ directory to an MQTT topic named N3URON/BLUELAKE/ The InfluxDB payload format has been selected in the configuration for seamless message serialization.
This image displays how to configure an MQTT Publisher in N3uron with the InfluxDB payload format.
Configuring Grafana
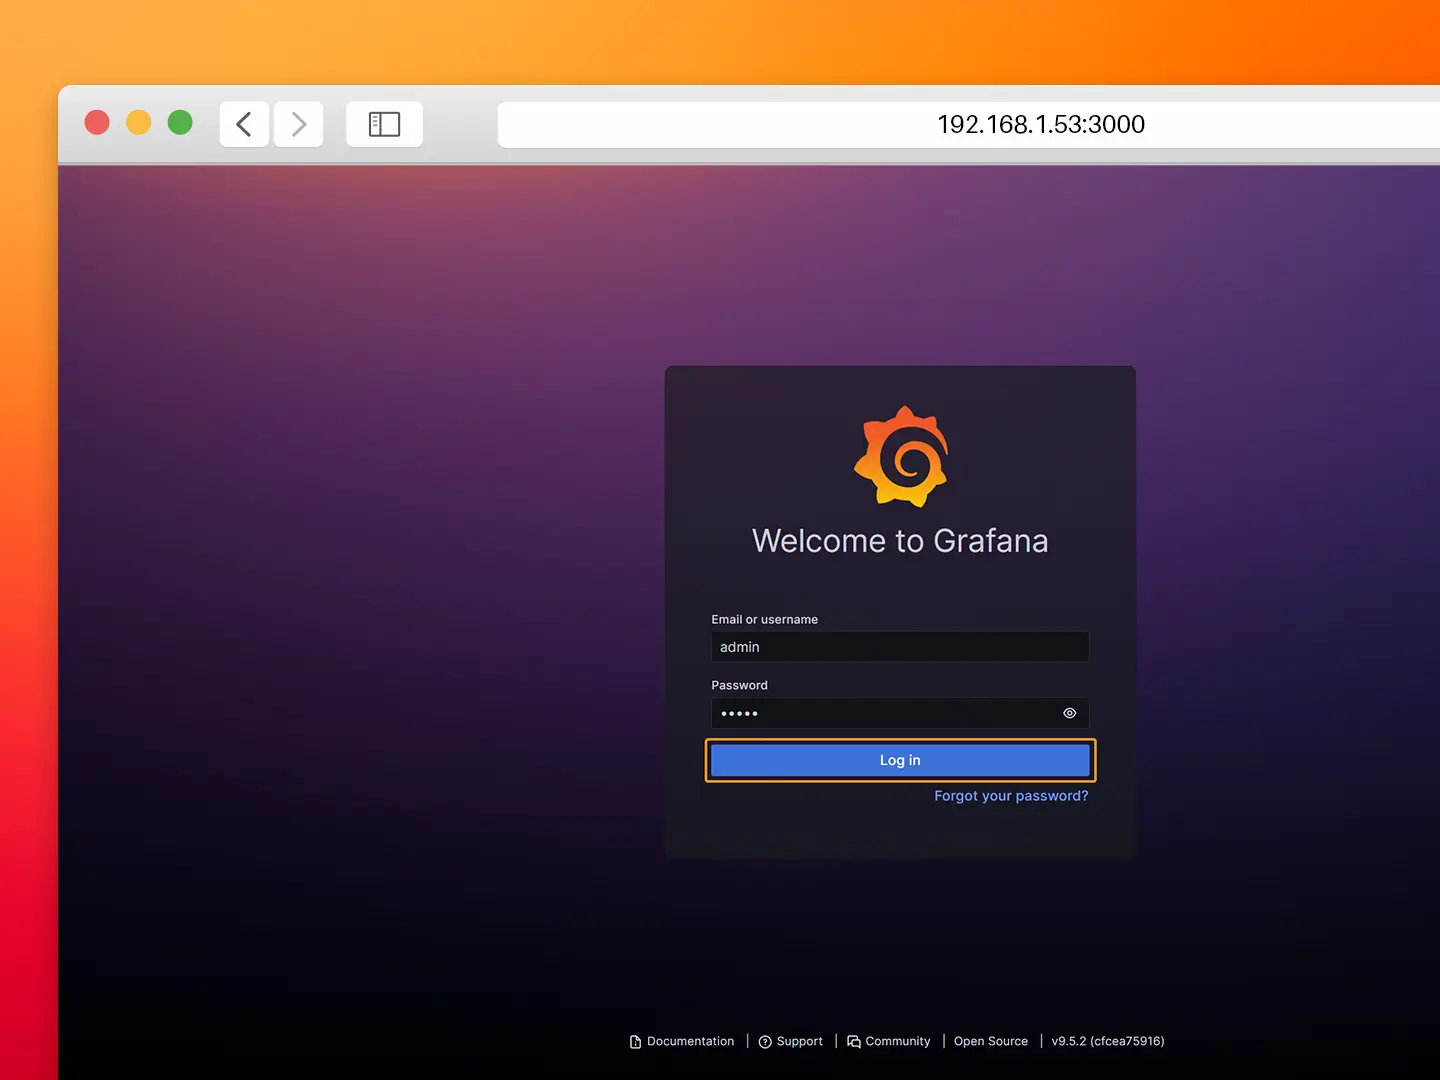
- Step 1: Go to http://
:3000/ and login to Grafana.
– User: admin
– Password: n3uron
This image shows Grafana’s logging page.
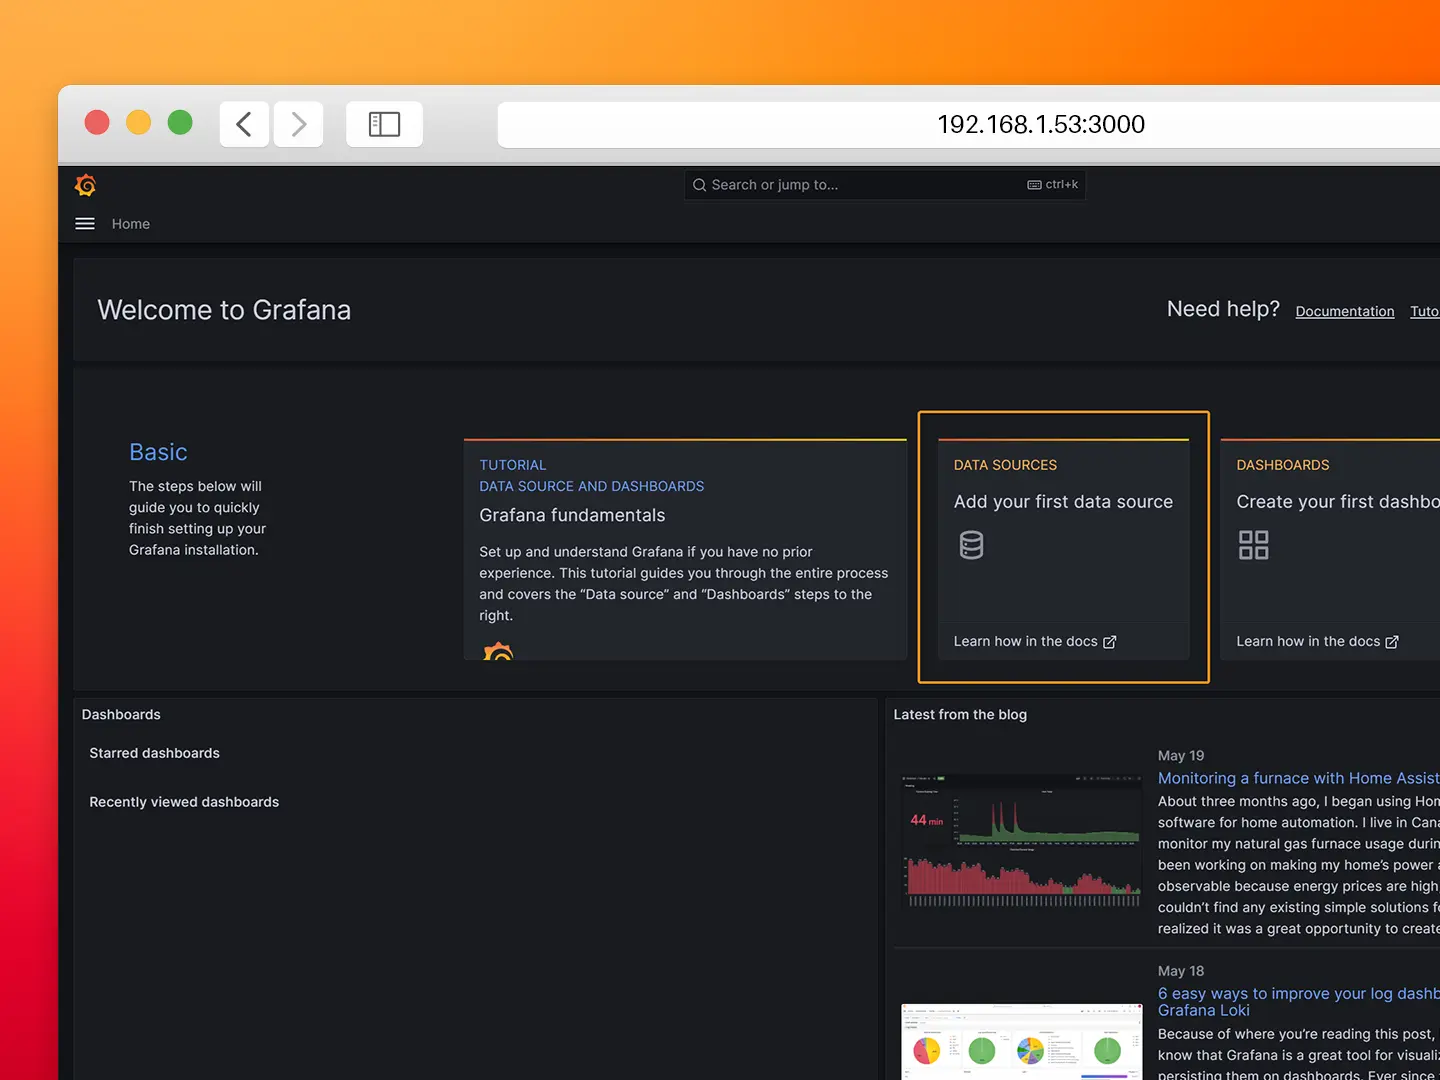
- Step 2: Click on Add your first data source.
The image illustrates the second step of the configuration process, where users are guided to click on “Add your first data source” in Grafana.
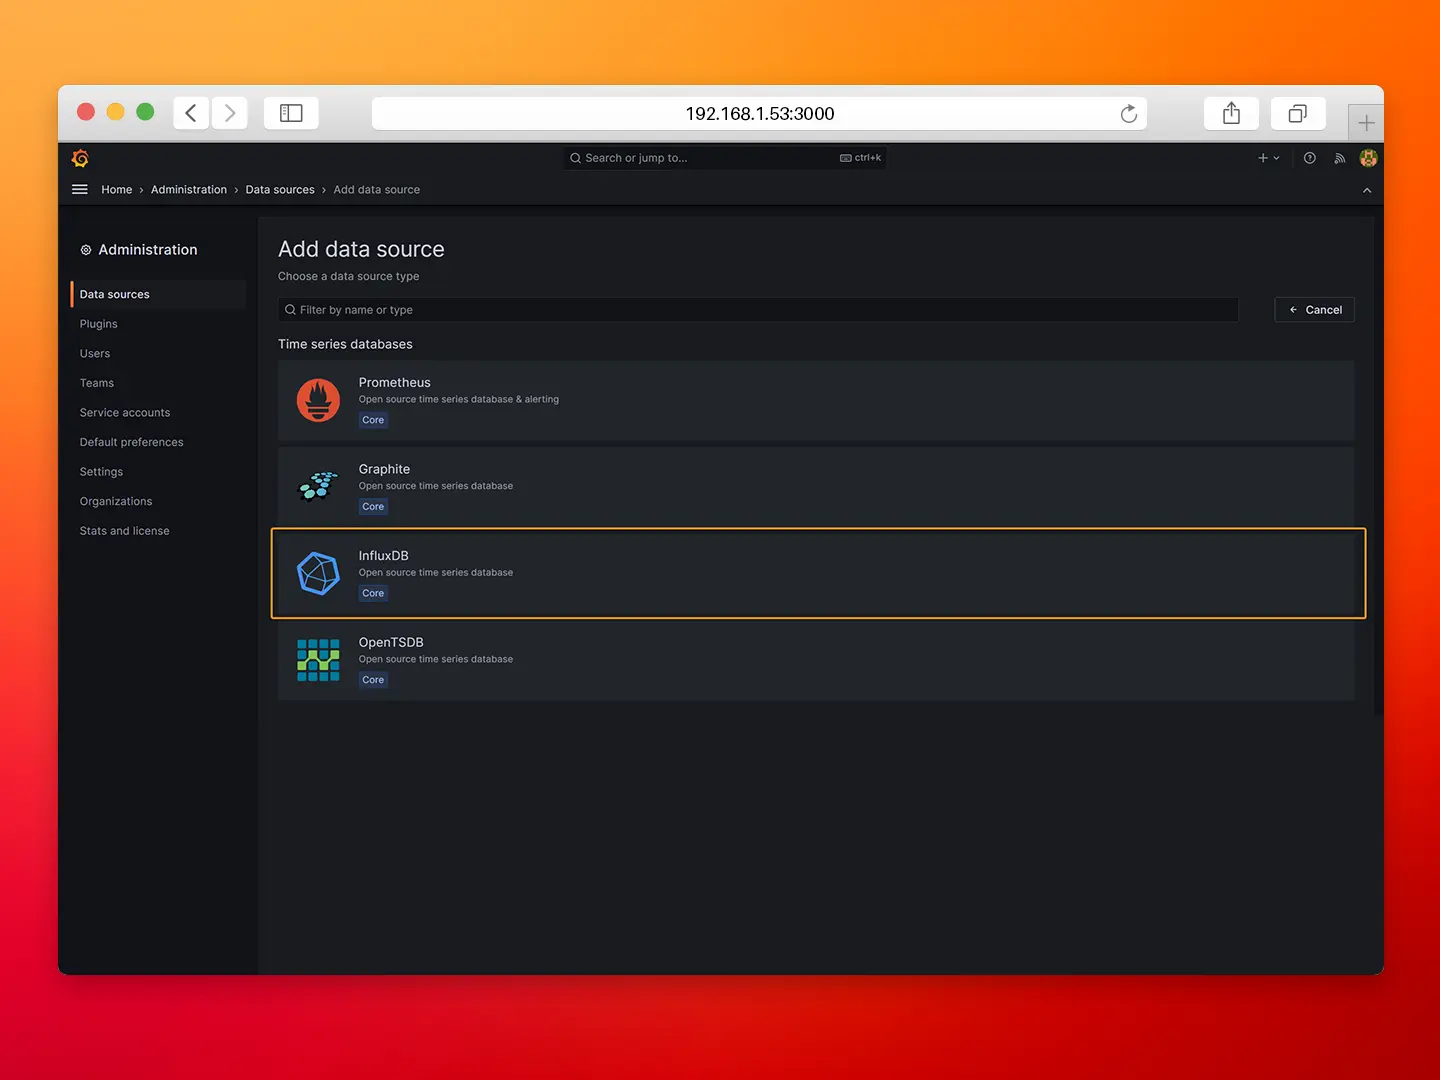
- Step 3: Select InfluxDB as data source.
The image represents the third step of the configuration process, where users are guided to select InfluxDB as the data source in Grafana.
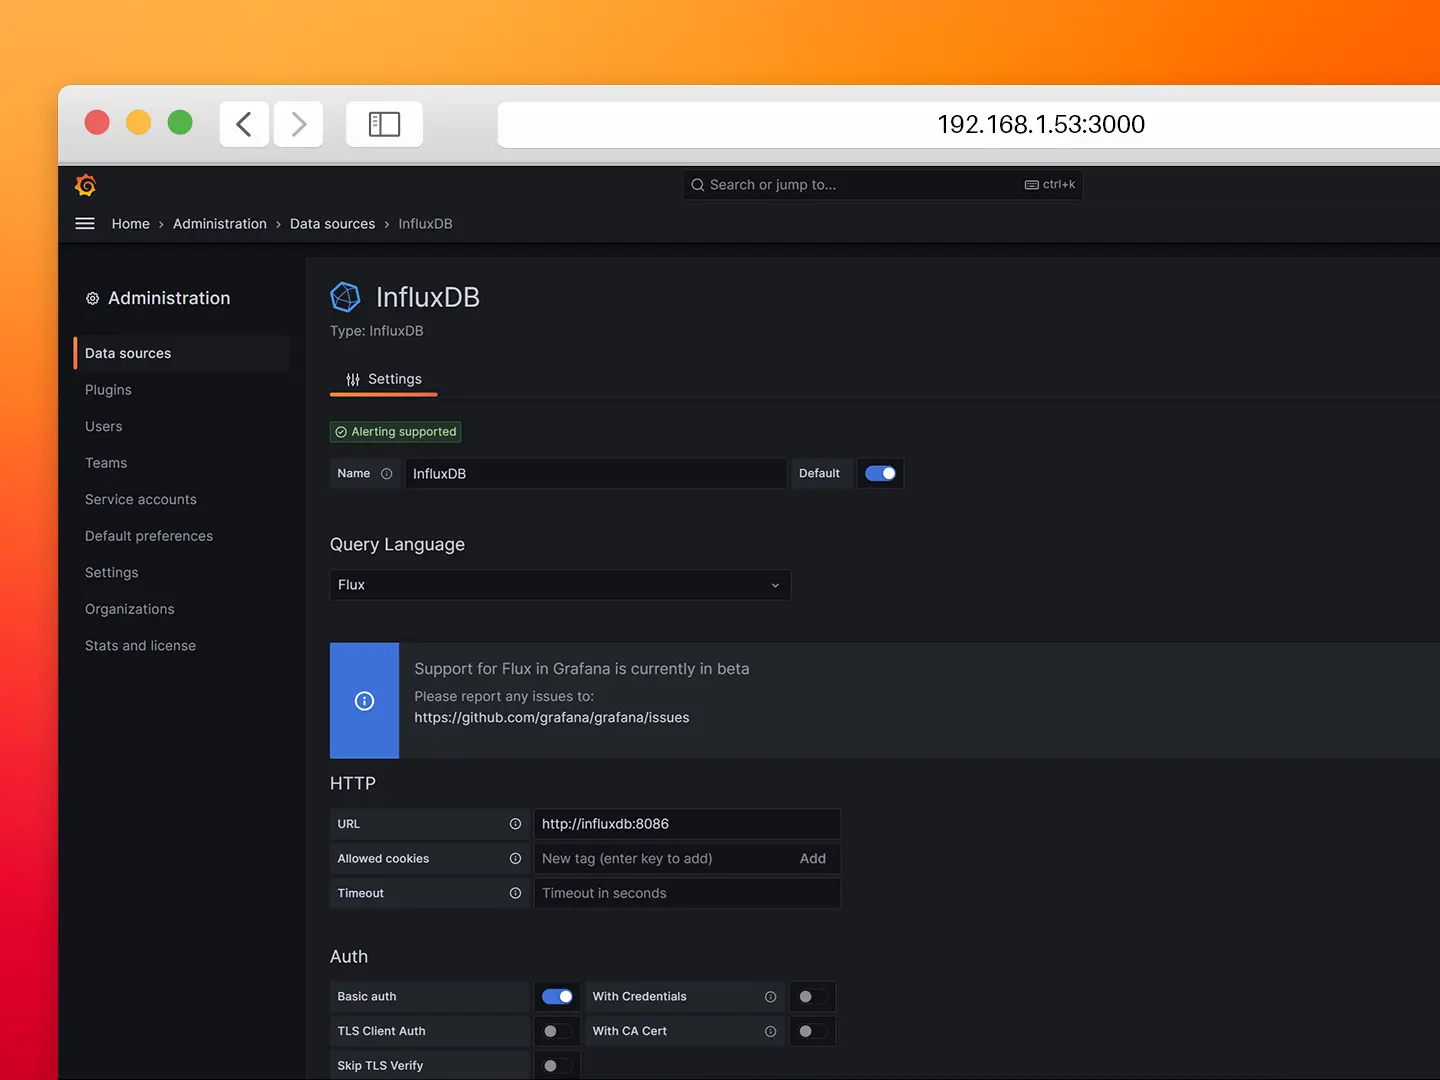
- Step 4: Configure the InfluxDB connection as follows.
– Query Language: Flux
– URL: http://influxdb:8086
– Organization: N3uron
– Token: iXm3eMP5ioUUntSZuHYWzjJPT
– Default Bucket: demo
The image illustrates the fourth step of the configuration process, where users are guided to configure the InfluxDB connection in Grafana.
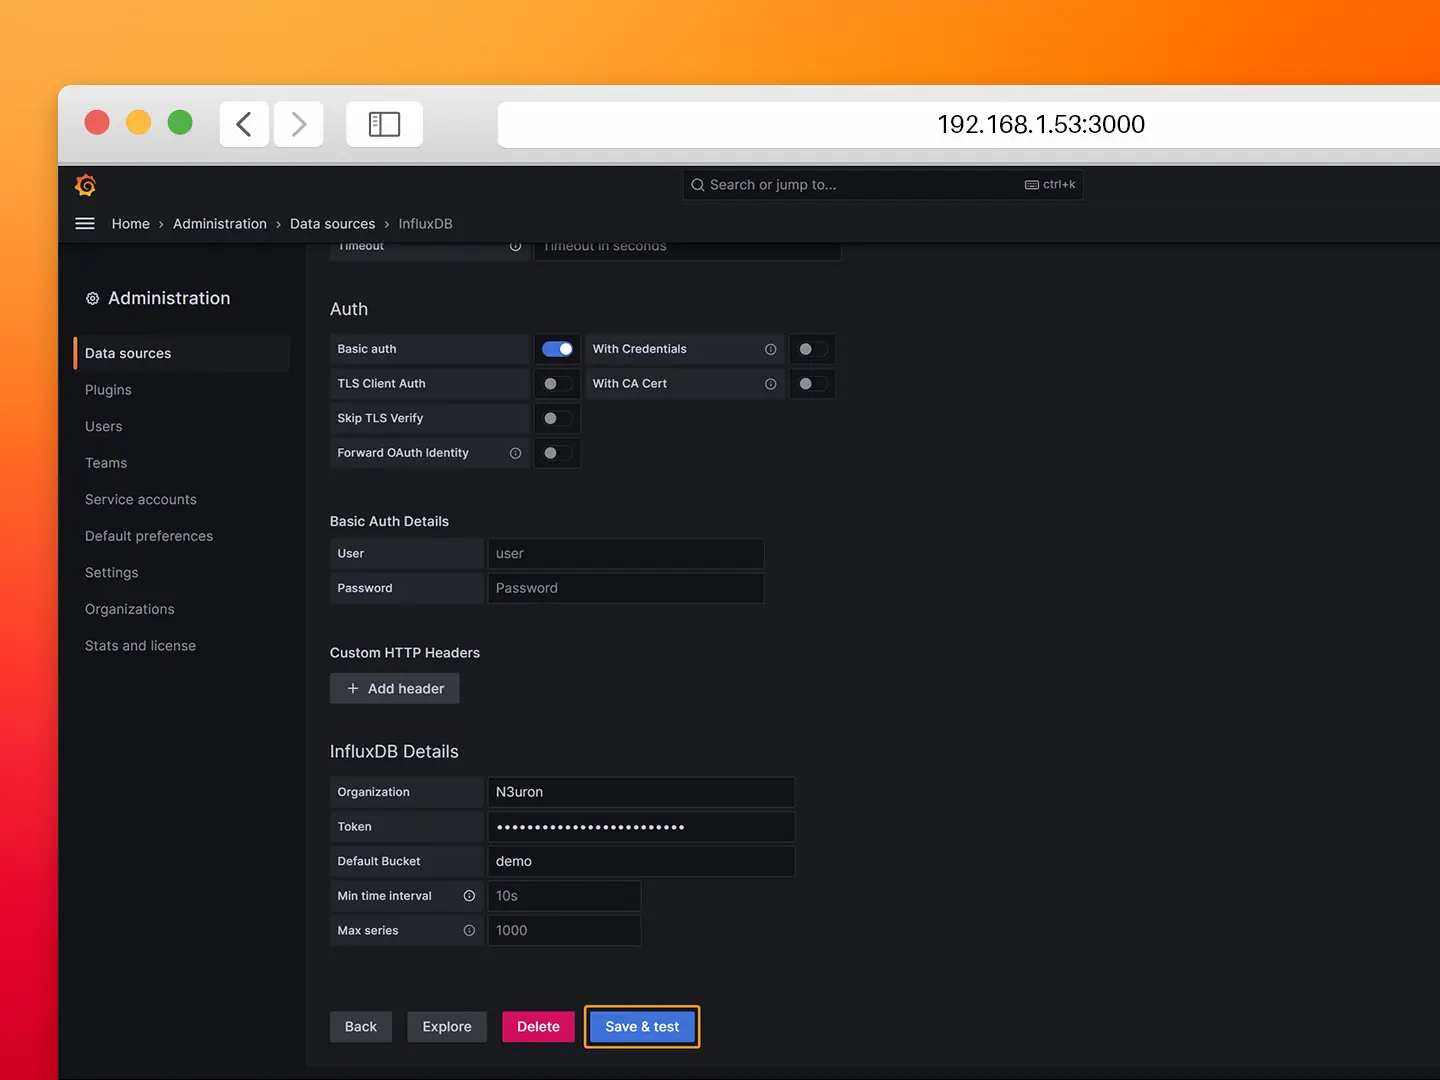
- Step 5: Click on Save & Test. If you encounter any error with the data source review your settings.
The image depicts the fifth step of the configuration process, where users are instructed to click on “Save & Test” in Grafana.
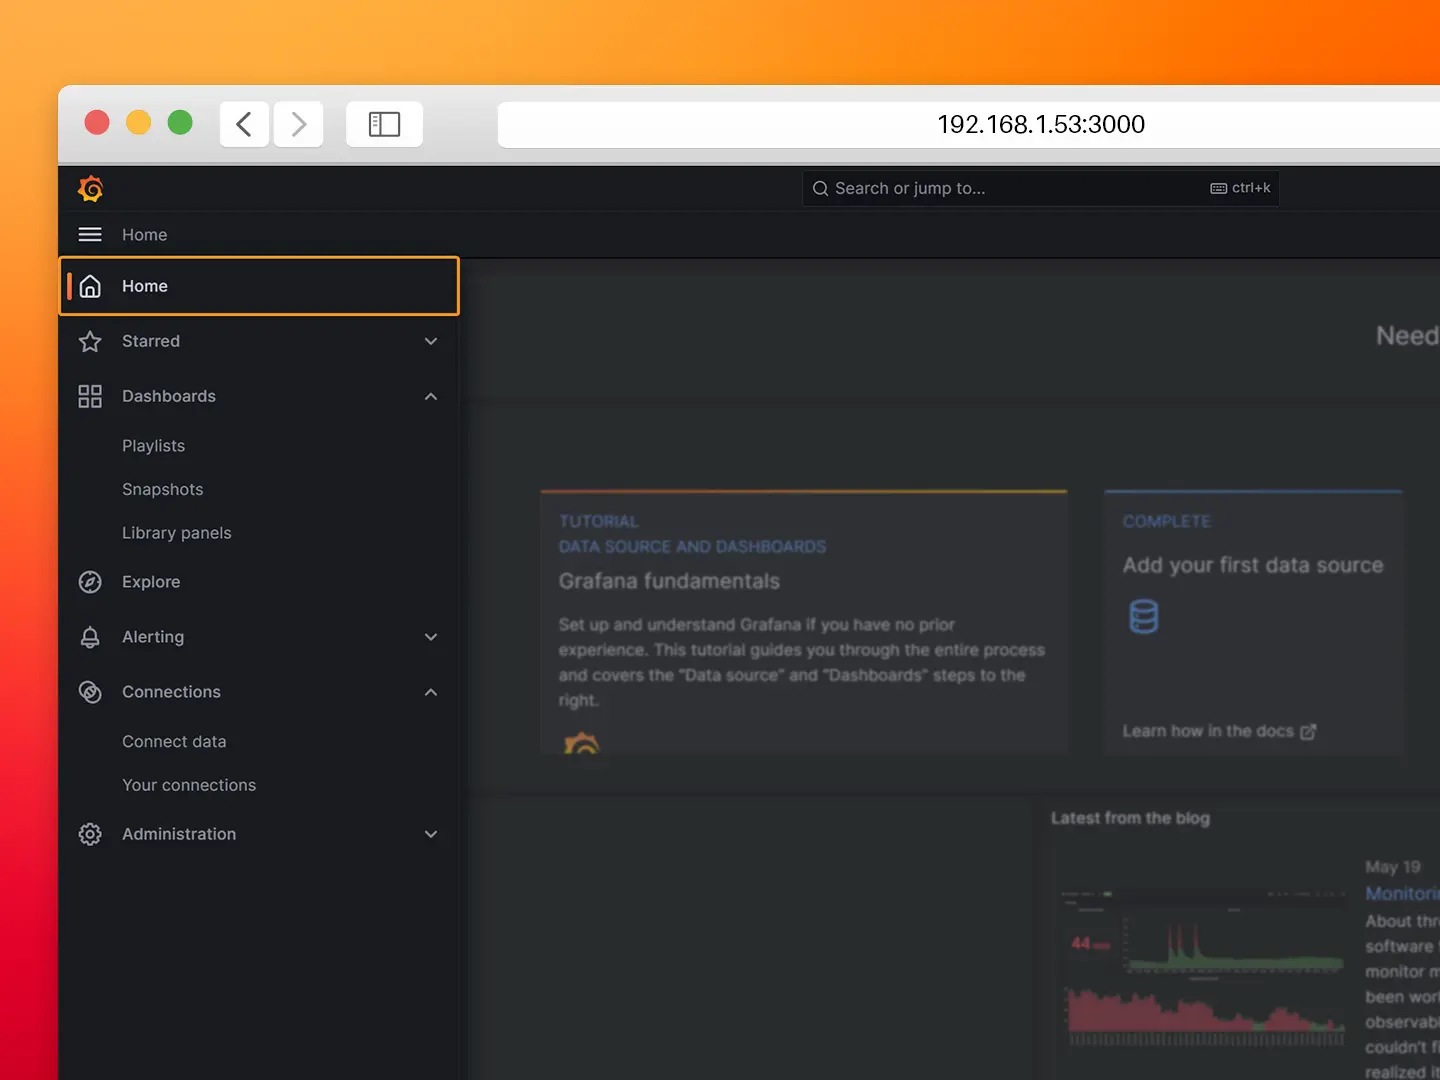
- Step 6: Hover the mouse over the Home menu and select Dashboards.
The image showcases the sixth step of the navigation process, where users are instructed to hover the mouse over the Home menu in Grafana and select Dashboards.
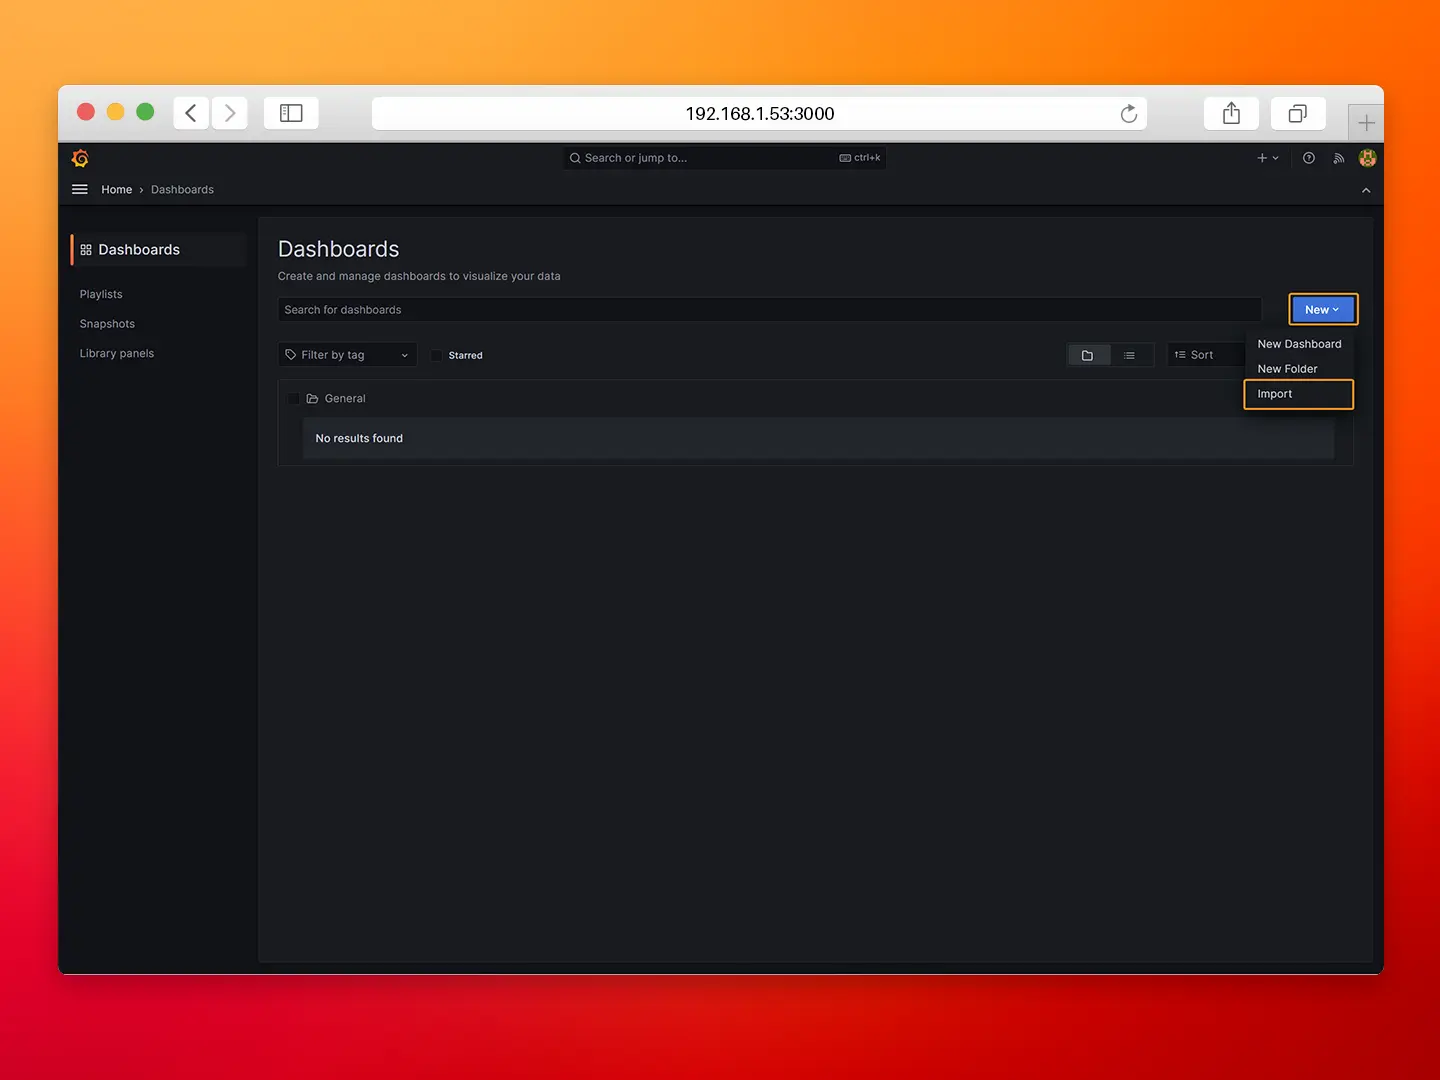
- Step 7: Click on New→Import.
The image represents the seventh step of the navigation process, where users are guided to click on “New” and select “Import” in Grafana.
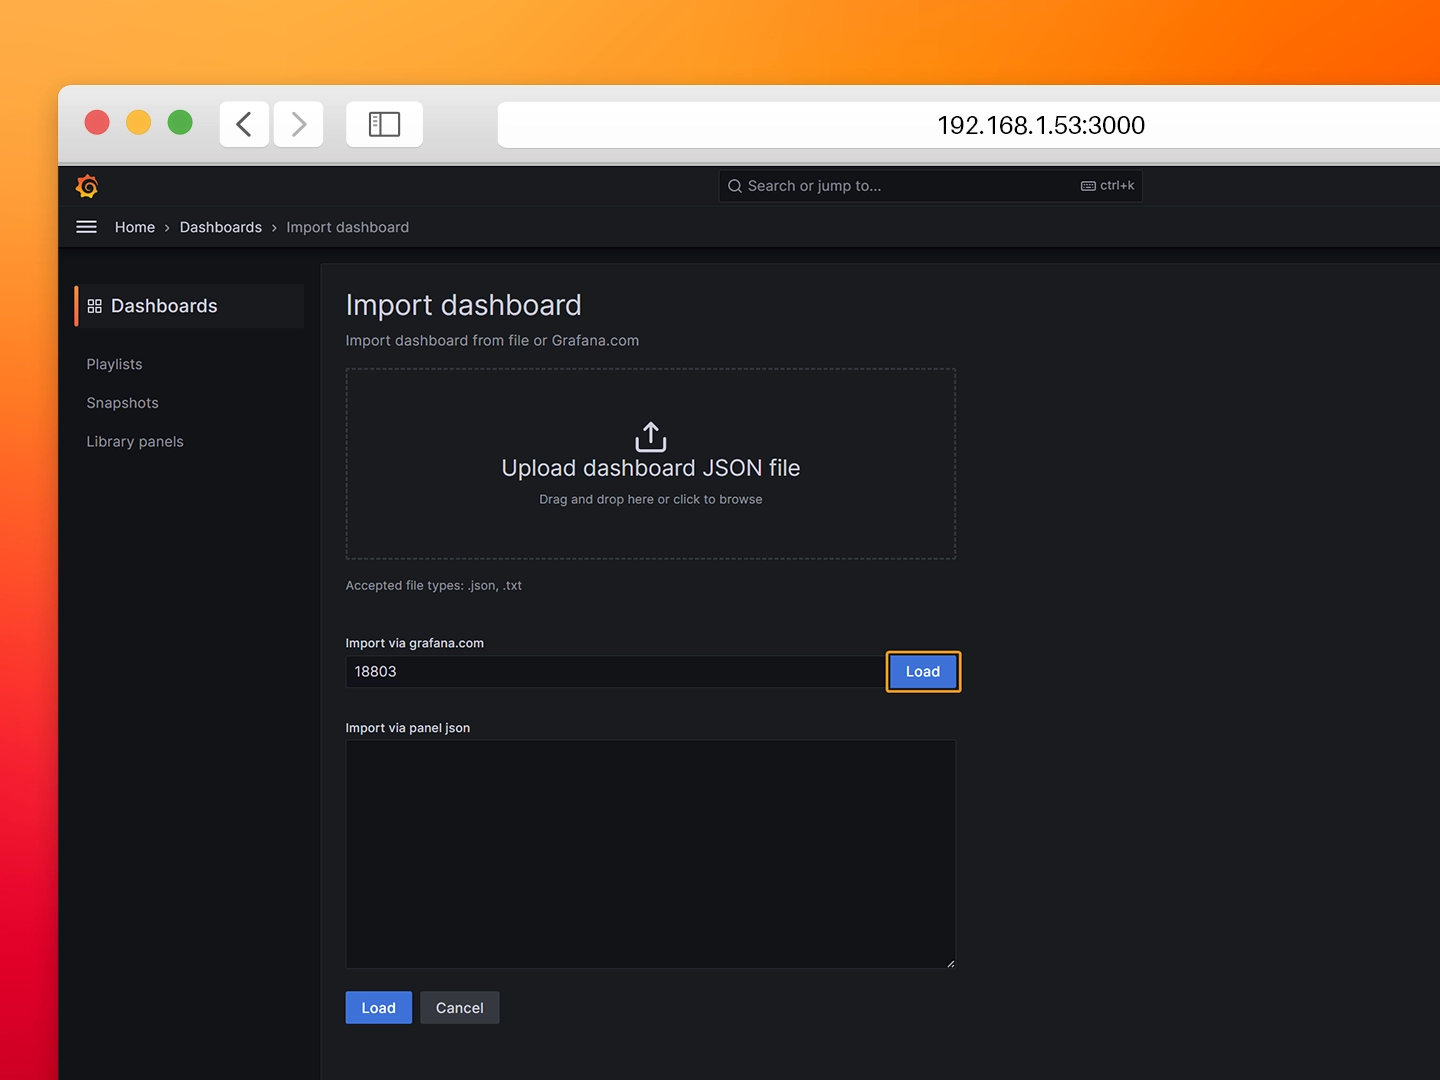
- Step 8: Load the dashboard from Grafana.com.
– ID: 18803
The image showcases the eighth step of the dashboard import process, where users are instructed to load a specific dashboard from Grafana.com.
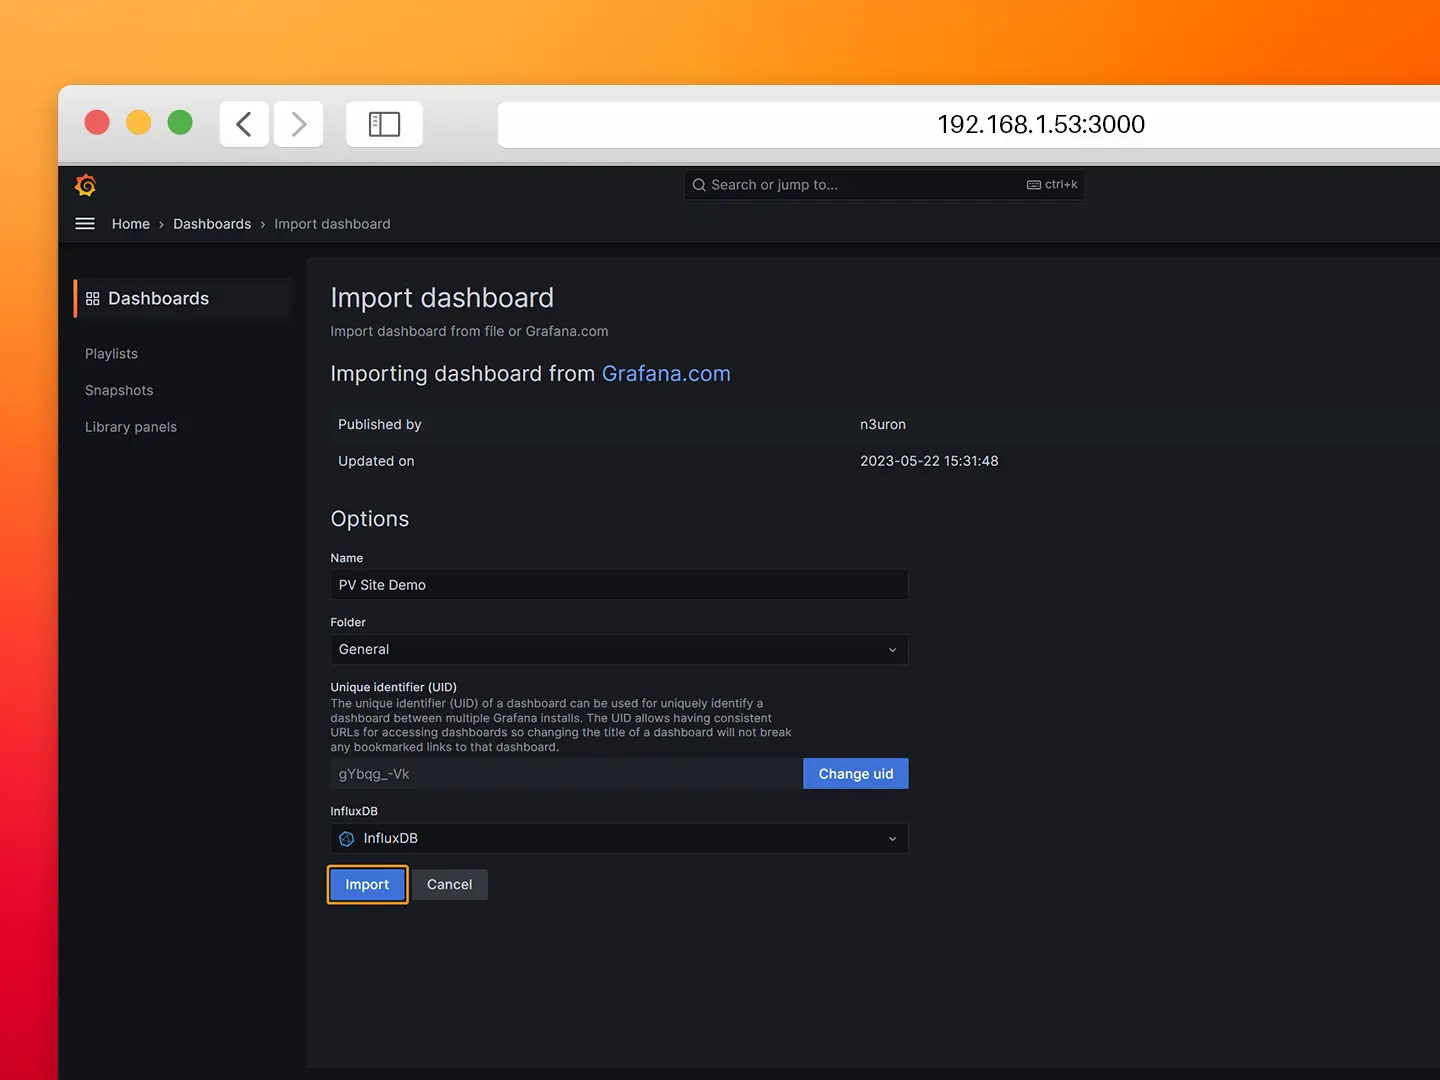
- Step 9: Select the previously created InfluxDB data source and click on Import.
The image represents the ninth step of the dashboard import process, where users are guided to select the previously created InfluxDB data source and click on Import in Grafana.
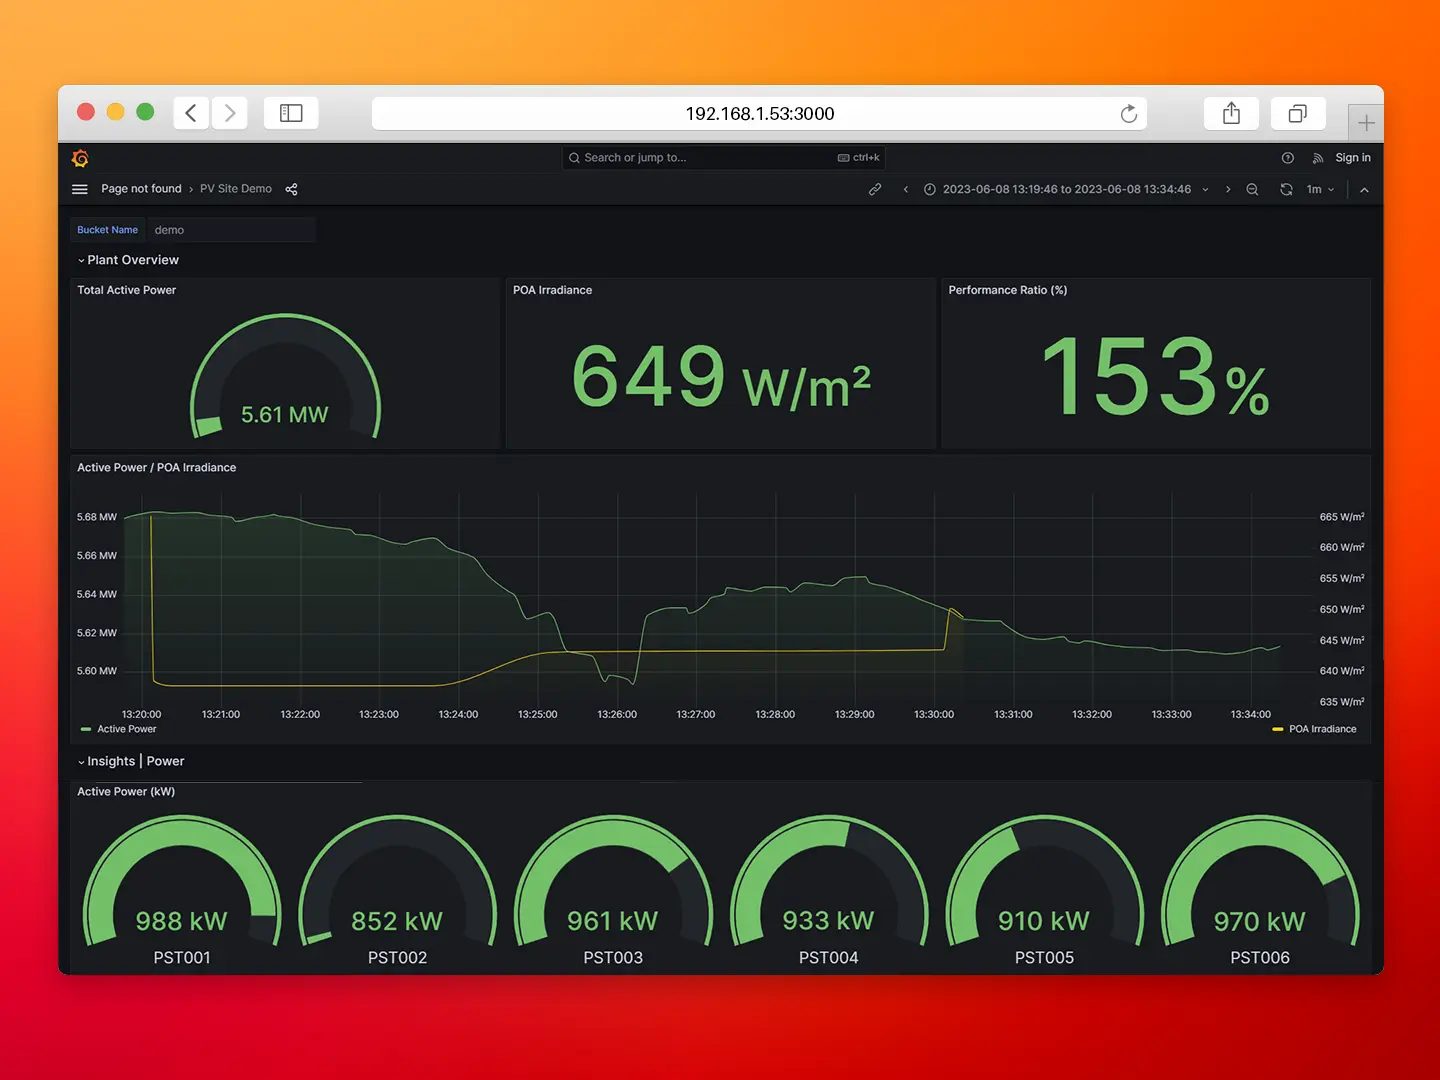
The image showcases the visual representation of a Grafana Dashboard after the successful import of the InfluxDB data source.
Conclusion
In summary, we have seen how the integration of balena with N3uron and other applications in a containerized architecture provides businesses with a powerful tool to harness the full potential of their data.
Deploying and managing this solution at the Industrial Edge has never been easier, thanks to balena’s user-friendly features. With simple provisioning for new hardware, automatic OS updates, seamless software deployments and unified management from their dashboard, balena streamlines operational processes. With N3uron and balena, the possibilities are endless.
Optimize your operations, discover new insights and stay ahead of the curve with N3uron. Take the first step on your digital journey by downloading the containerized version of the N3uron platform from Downloads. Select the modules you need to build your custom solution and unlock the full potential of your data.
